This data presents Australia’s small businesses according to their areas of operation, focusing on each state and territory.
Key findings for the year to 30 June 2023
- The number of small businesses increased in all states and territories except Victoria. Victoria’s decrease can be attributed to a decrease in the number of small businesses in Greater Melbourne.
- The largest increases in percentage terms were in the Australian Capital Territory (3.3%) and Queensland (2.1%).
- The top five regions with the highest number of small businesses were all in Greater Capital City areas: Sydney Inner City (NSW), Melbourne City (Vic), Wyndham (Vic), Boroondara (Vic), and Perth City (WA).
- The regional areas with the highest number of small businesses were Geelong (Vic), Ormeau – Oxenford (Qld), Newcastle (NSW), Toowoomba (Qld) and Townsville (Qld).
There were 849,075 small businesses in New South Wales (NSW) on 30 June 2023. These accounted for 34% of all Australian small businesses (compared to 31% of the population that live in NSW1). In NSW, the number of small businesses increased by 1% in the year to June 2023.
Chart 1: Small business in NSW, 30 June 2023
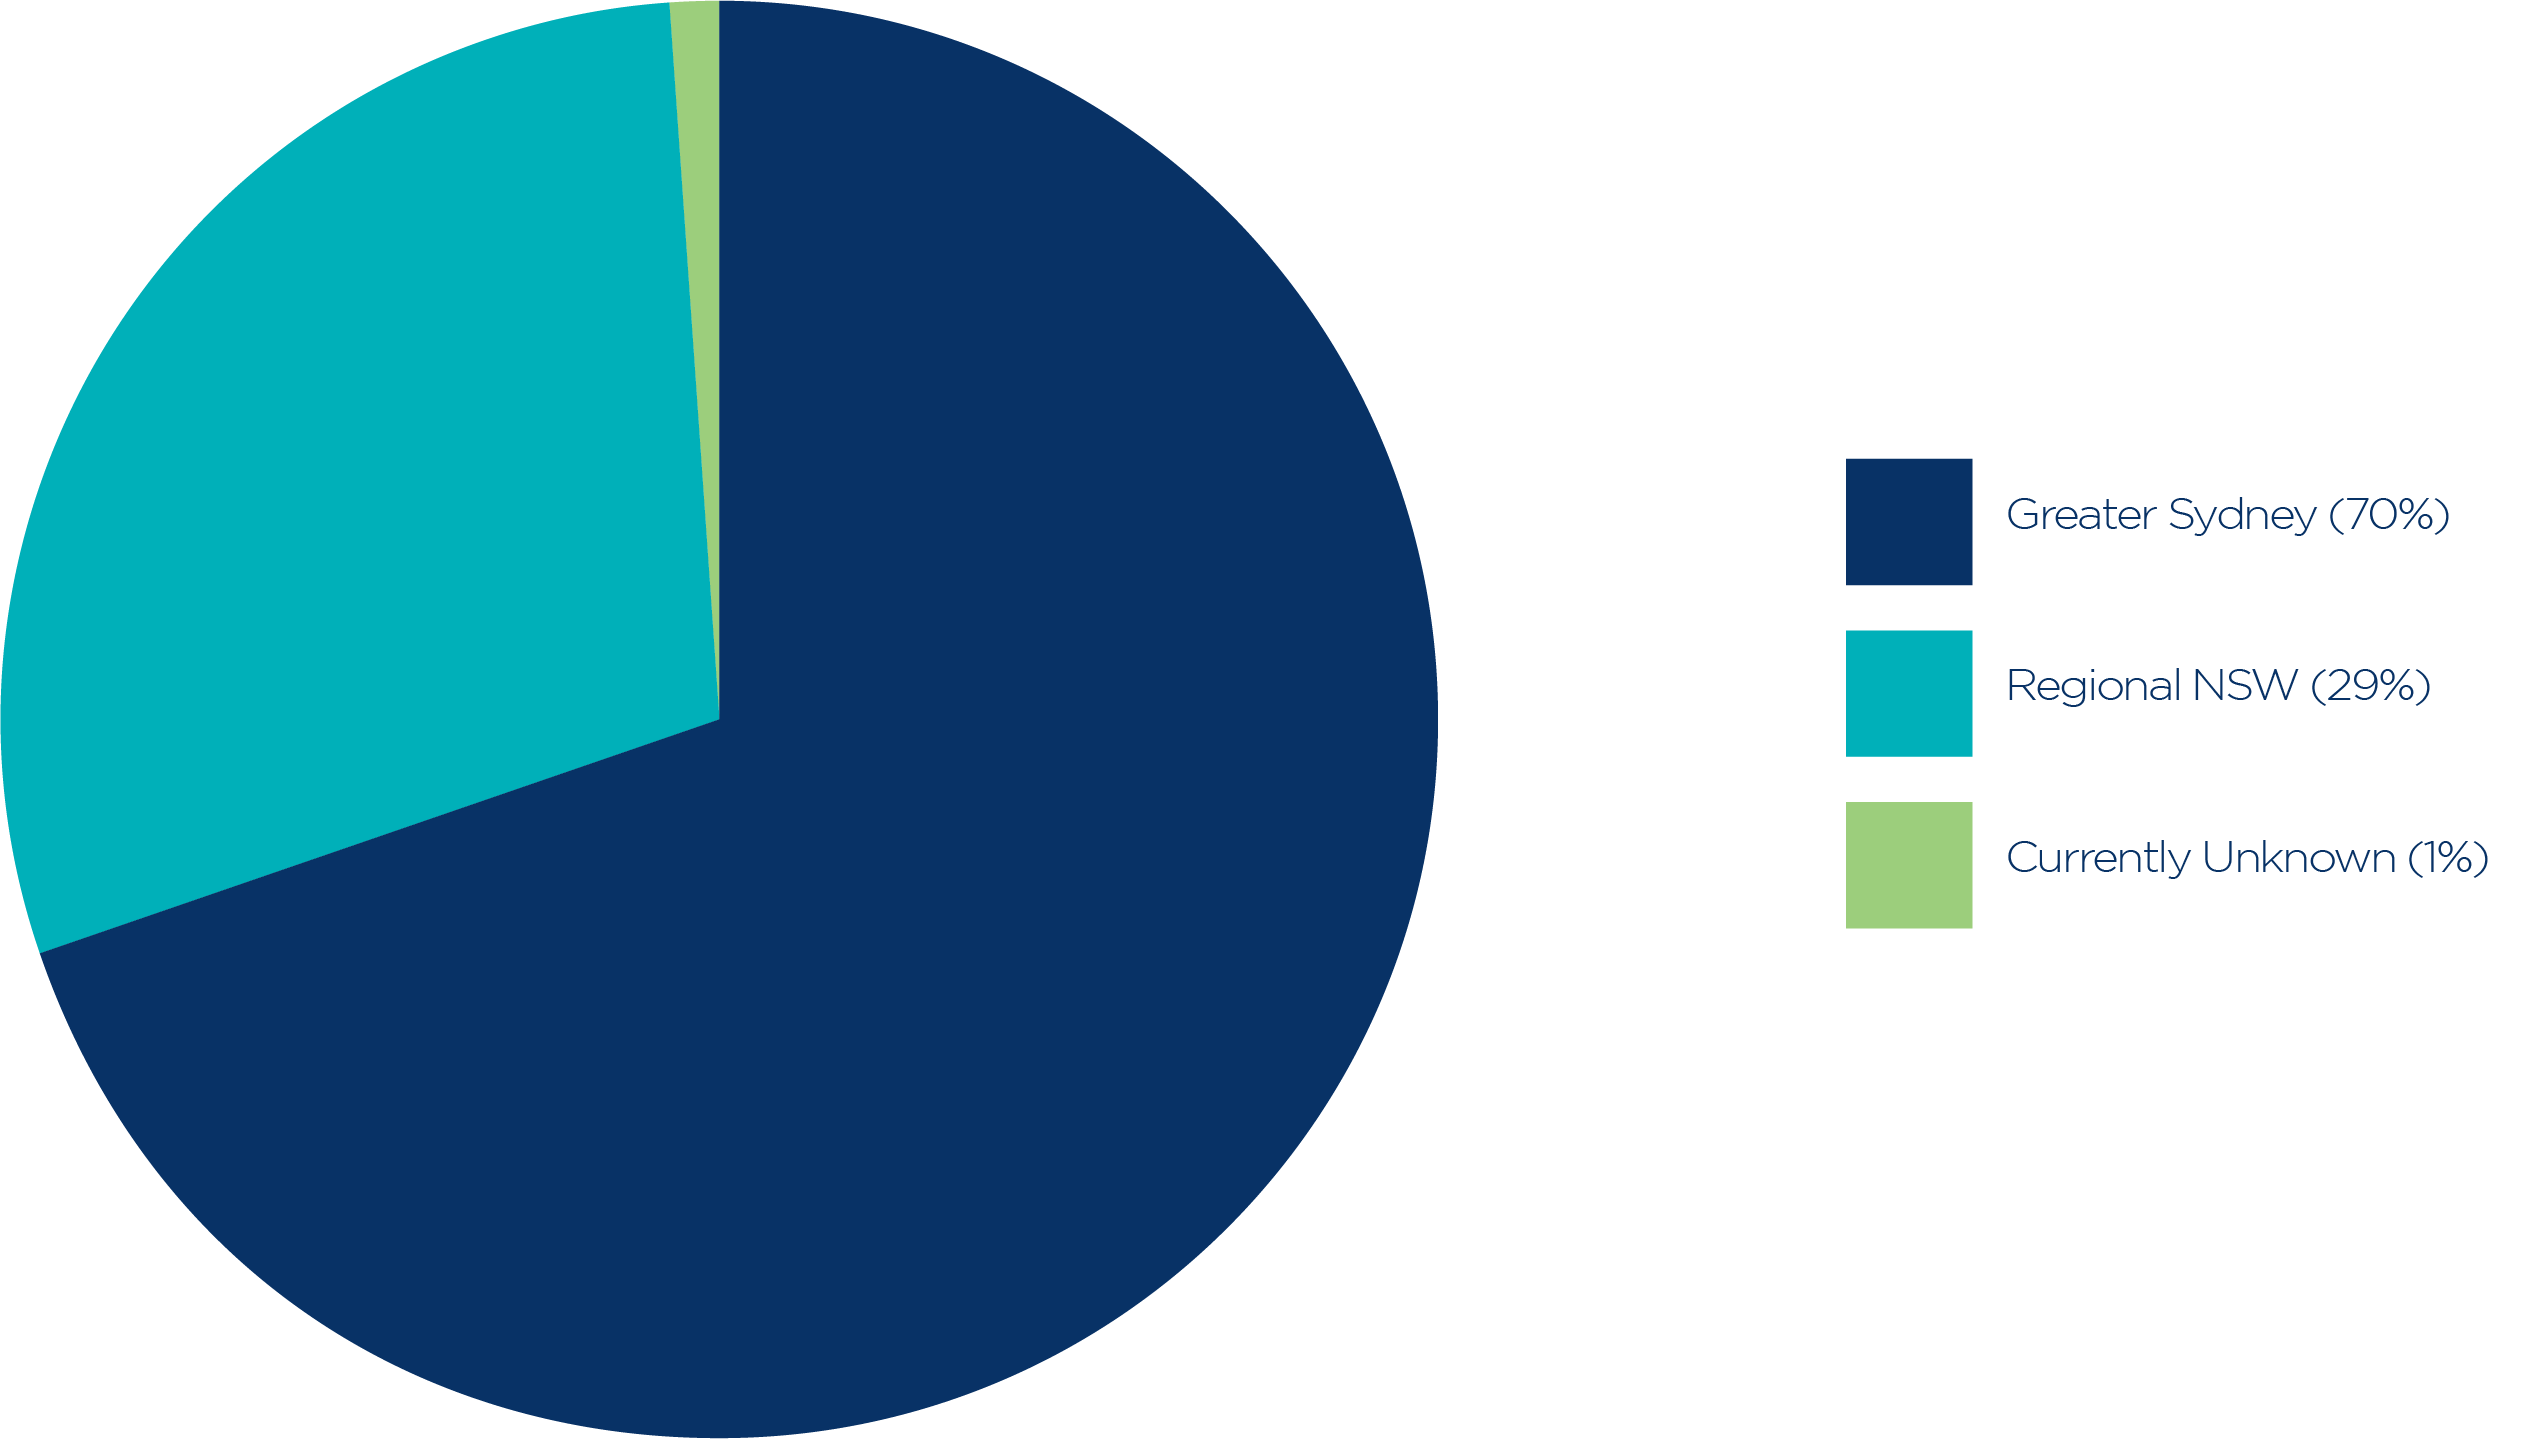
“Currently Unknown” is comprised of a small number of businesses where information is only available at the state/territory level.
Source: Based on Australian Bureau of Statistics, customised data, 2023.
Greater Sydney
There were 594,855 small businesses in Greater Sydney on 30 June 2023, representing 70% of all small businesses in NSW. The number of small businesses in the greater capital city area increased by 3,104 (representing an increase of 0.5%) over the year to June 2023.
The Greater Sydney areas with the highest number of small businesses on 30 June 2023 were:
- Sydney Inner City (74,583 small businesses). Of these, 50% were in Sydney (North) – Millers Point.
- Eastern Suburbs – North (22,003 small businesses). Of these, 20% were in Bondi Junction – Waverly.
- Bankstown (20,471 small businesses). Of these, 13% were in Bankstown – South and 13% were in Condell Park.
- Baulkham Hills (19,329 small businesses). Of these, 30% were in Baulkham Hills (West) – Bella Vista.
- Merrylands – Guildford (18,325 small businesses). Of these, 16% were in Merrylands – Holroyd and 16% were in Granville – Clyde.
Regional New South Wales
There were 249,179 small businesses in the rest of NSW, accounting for 29% of NSW small businesses on 30 June 2023. The number of small businesses in the rest of the state increased by 3,404 (up 1.4%) in the year to 30 June 2023.
The areas with the highest number of small businesses were:
- Newcastle (15,227 small businesses). Of these, 18% were in Newcastle – Cooks Hill.
- Richmond Valley – Coastal (11,052 small businesses). Of these, 34% were in Ballina and surrounds and 19% were in Byron Bay.
- Wollongong (10,662 small businesses). Of these, 24% were in Wollongong – East.
- Wagga Wagga (9,266 small businesses). Of these, 72% were in Wagga Wagga and surrounds. An additional 9% were in Temora.
- Lake Macquarie – East (8,771 small businesses). Of these, 23% were in Charlestown – Dudley.
1 Australian Bureau of Statistics, Regional Population, 2021-22, Accessed 15 January 2024
Table 1: Businesses in NSW by size, 30 June 2023
Number of employees | Number of businesses Greater Sydney | Number of businesses in the rest of NSW | Total number of businesses in NSW1 |
Non-employing | 357,626 | 148,516 | 509,485 |
1-4 employees2 | 188,702 | 74,202 | 264,152 |
5-19 employees | 48,527 | 26,461 | 75,438 |
Small businesses (0-19 employees)3 | 594,855 | 249,179 | 849,075 |
20-99 employees | 12,286 | 5,549 | 18,223 |
100-199 employees | 1,293 | 327 | 1,861 |
200+ employees | 702 | 129 | 1,757 |
Total | 609,136 | 255,184 | 870,916 |
1Includes businesses where information is only available at the state/territory level.
2 This includes a small number of businesses which have income tax withholding roles for purposes other than withholding amounts from wages and salaries (and as such have zero employment).
3Calculated by the ASBFEO based on the ABS definition of small business of 0-19 employees.
Source: Based on Australian Bureau of Statistics, customised data, 2023.
Changes in small business numbers for NSW
Chart 2: Annual change in the number of small businesses in NSW
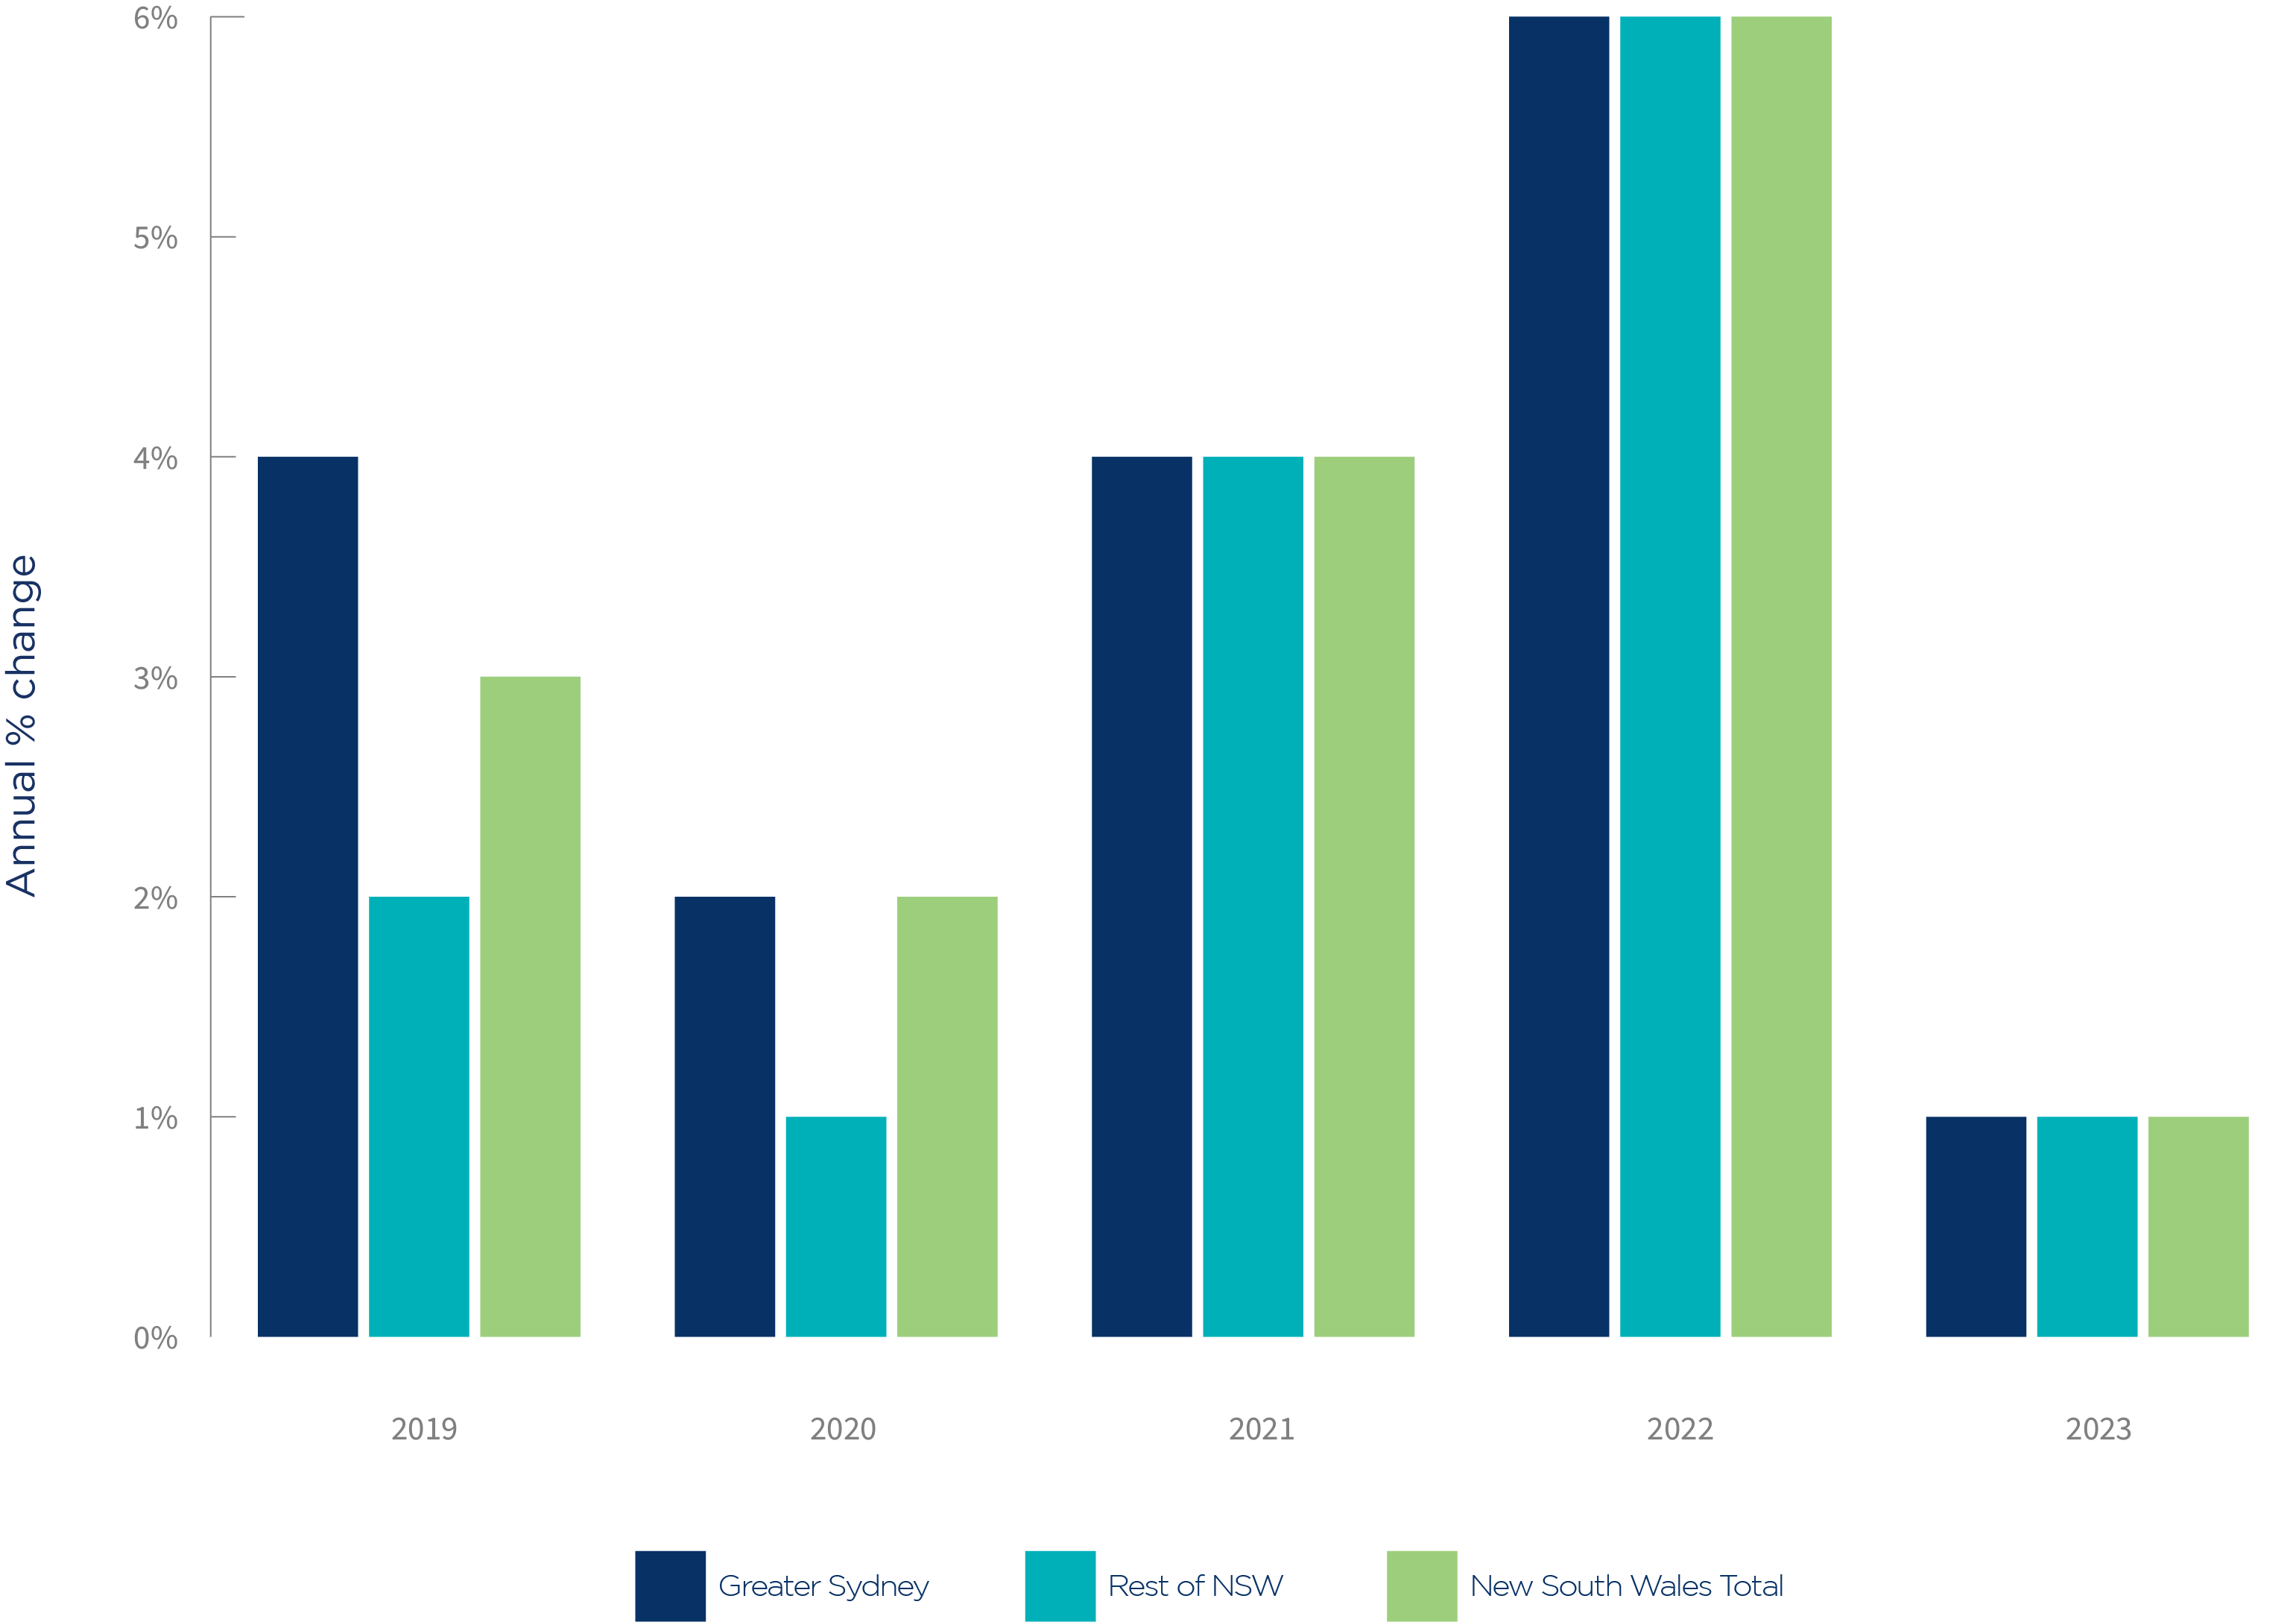
Total includes a small number of businesses where information is only available at the state/territory level.
Source: Based on Australian Bureau of Statistics, customised data, 2023.
The number of small businesses in NSW increased by 1% over the year to 30 June 2023. They increased by 3,104 (0.5%) in Greater Sydney. The areas with the largest increase in the number of small businesses were:
- Blacktown – North (increased by 981 small businesses)
- Sydney Inner City (increased by 800 small businesses)
- Bringelly – Green Valley (increased by 476 small businesses).
The areas with the largest percentage increase in the previous year were:
- Blacktown North (increased by 9%)
- Rouse Hill – McGraths Hill (increased by 7%)
- Bringelly – Green Valley (increased by 4%).
The number of small businesses in the rest of NSW increased by 3,404 (1.4%) over the year to 30 June 2023. The areas with the largest increase in the number of small businesses were:
- Newcastle (increased by 317 small businesses)
- Richmond Valley – Coastal (increased by 242 small businesses)
- Tweed Valley (increased by 208 small businesses).
The areas with the largest percentage increase in the previous year were:
- Dapto – Port Kembla (increased by 3%)
- Maitland (increased by 3%)
- Port Macquarie (increased by 3%).
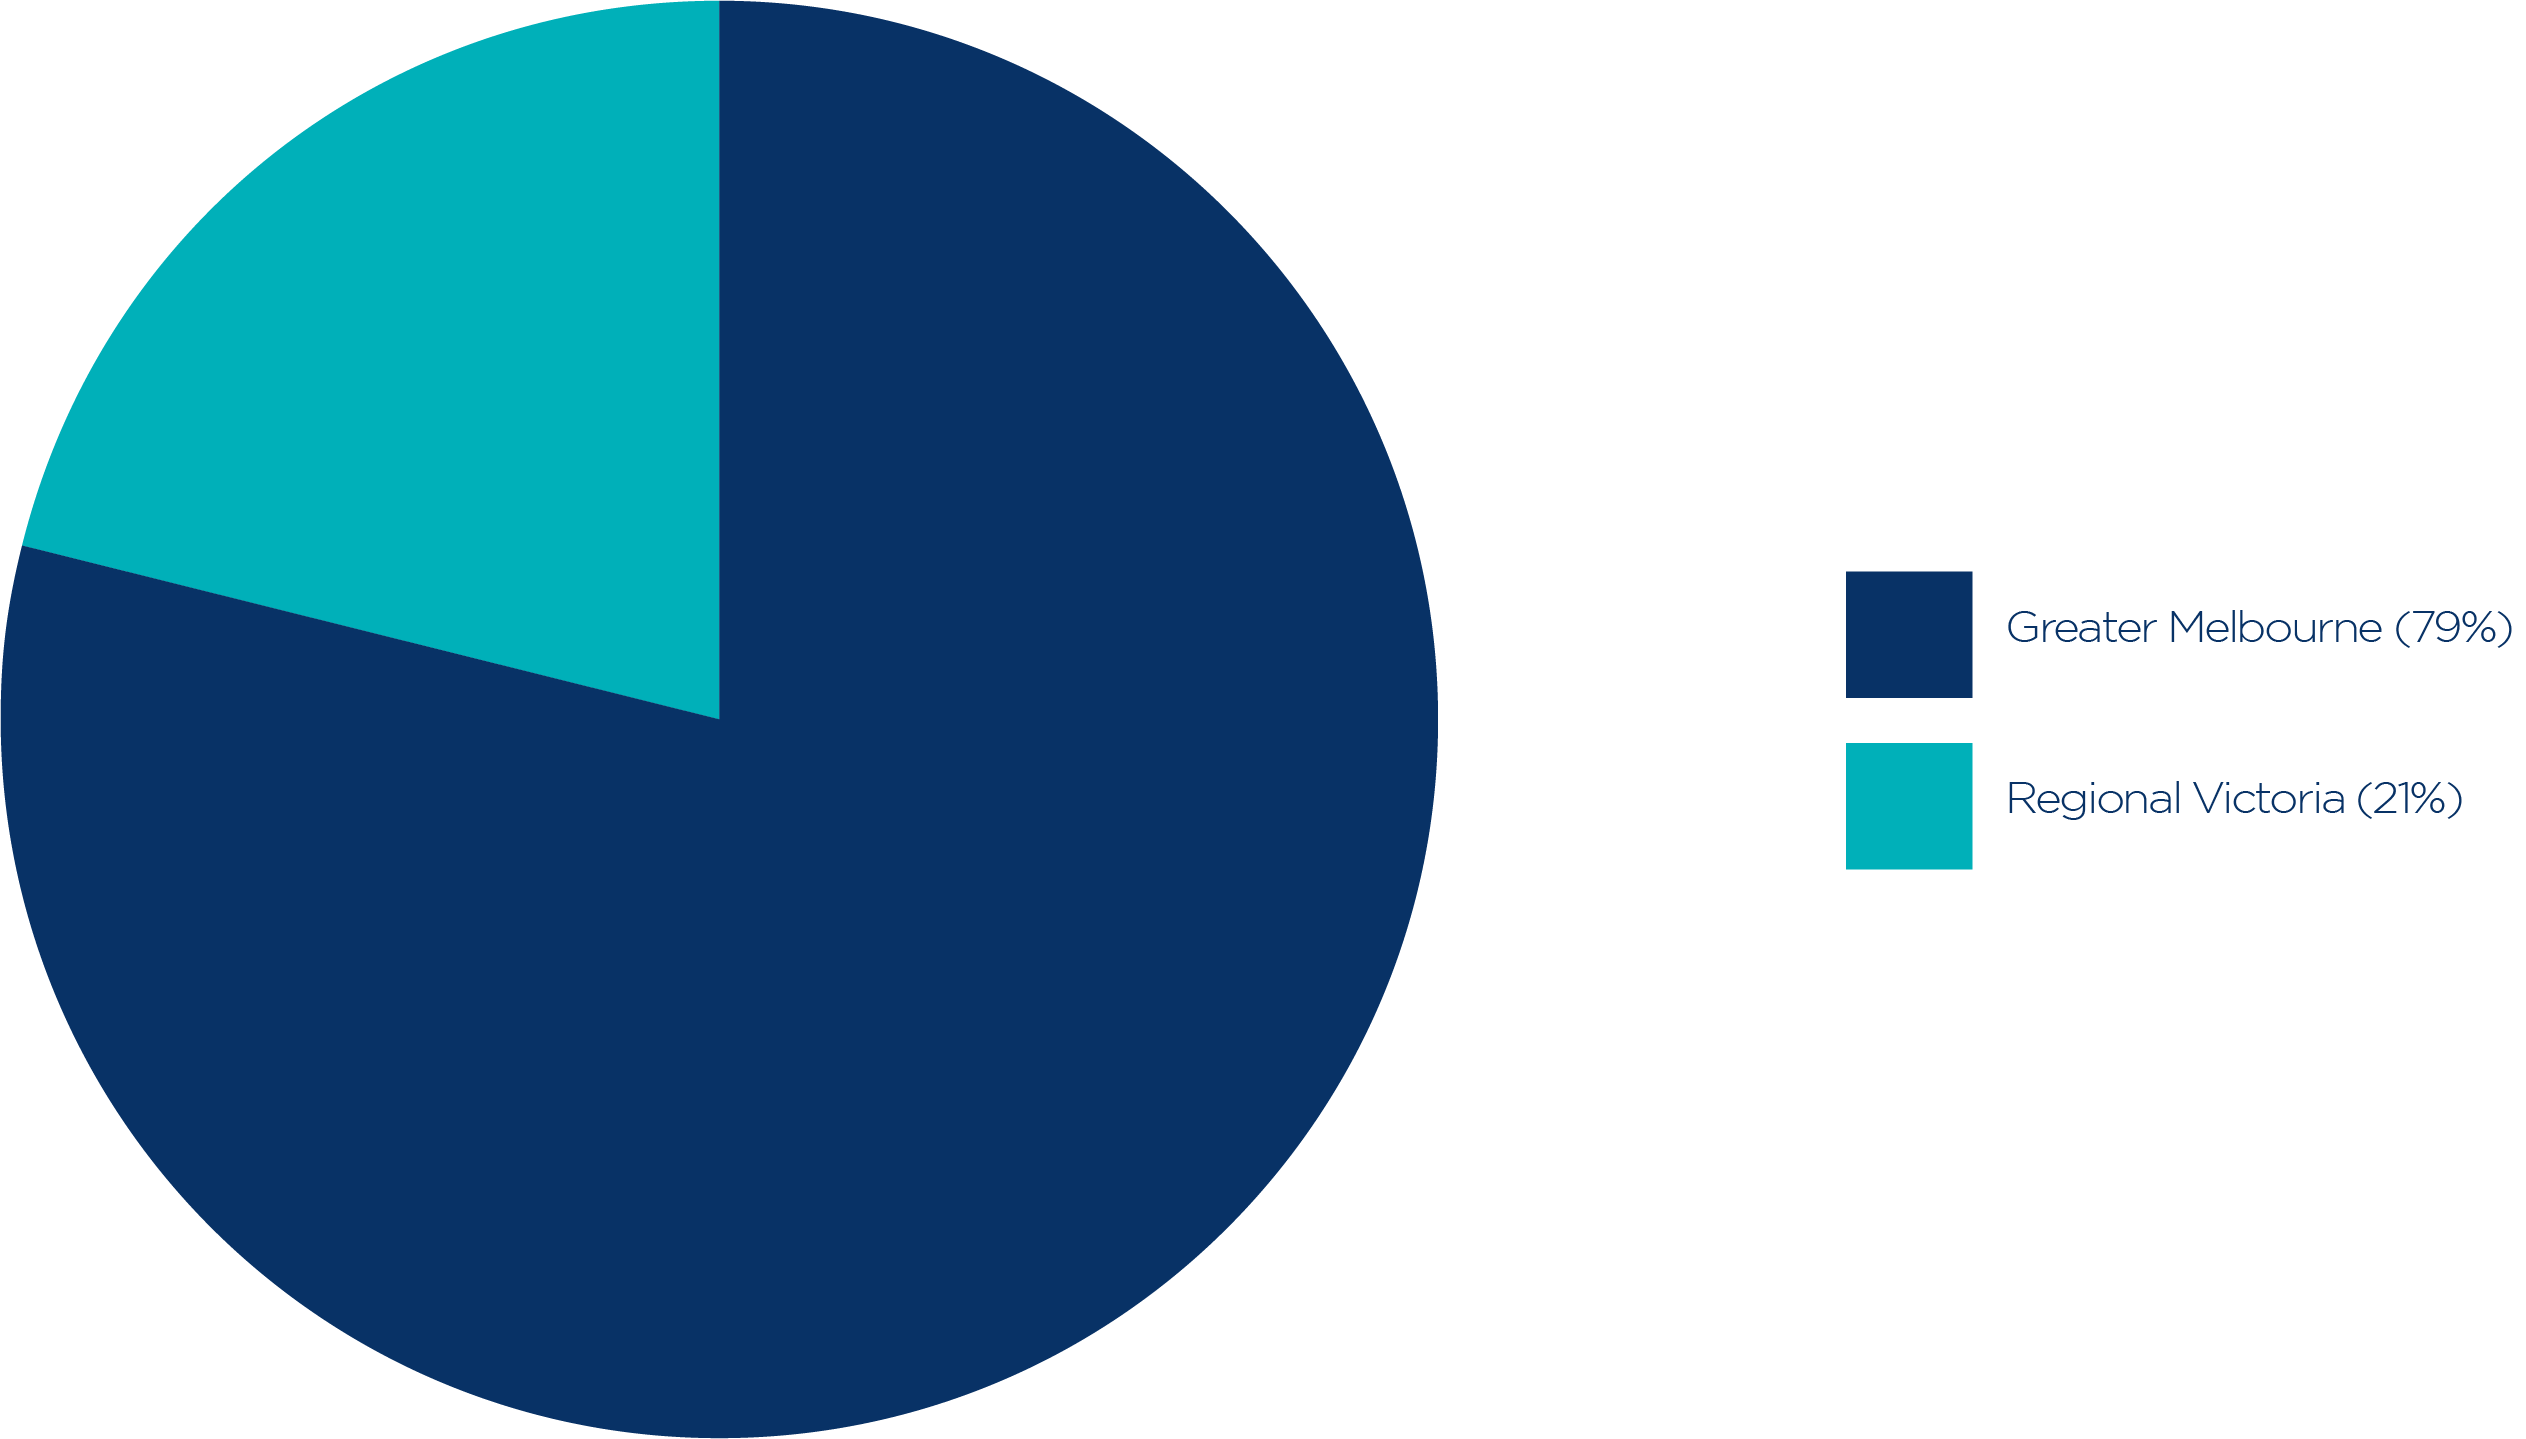
There were 701,061 small businesses in Victoria on 30 June 2023, representing 28% of all Australian small businesses (compared to 25% of the population that lives in Victoria2). This is a decrease of 9,389 small businesses or 1.3% from the previous financial year.
Chart 1: Small business in Victoria, 30 June 2023
Source: Based on Australian Bureau of Statistics, customised data, 2023.
Greater Melbourne
There were 550,957 small businesses in Greater Melbourne on 30 June 2023, representing 79% of all small businesses in Victoria. The areas of Greater Melbourne with the highest number of small businesses were:
- Melbourne City (40,685 small businesses). Of these, 35% were in Melbourne CBD – West.
- Wyndham (31,682 small businesses). Of these, 24% were in Tarneit, Mount Cottrell and surrounds.
- Boroondara (25,543 small businesses). Of these, 26% were in Hawthorn and surrounds and 22% were in Balwyn and surrounds.
- Whittlesea – Wallan (23,141 small businesses). Of these, 15% were in Epping and surrounds and 14% were in Thomastown.
- Monash (22,906 small businesses). Of these, 21% were in Mount Waverley and surrounds and 14% were in Oakleigh – Huntingdale.
Regional Victoria
There were 148,019 small businesses in the rest of Victoria on 30 June 2023, accounting for 21% of all Victorian small businesses. The areas with the highest number of small businesses were:
- Geelong (17,265 small businesses). Of these, 18% were in Geelong, 10% were in Geelong West – Hamlyn Heights and 10% were in Highton.
- Ballarat (9,723 small businesses). Of these, 27% were in Ballarat and 12% were in Alfredton.
- Surf Coast – Bellarine Peninsula (7,897 small businesses). Of these, 33% were in Torquay.
- Gippsland – South West (7,560 small businesses). Of these, 31% were in Wonthaggi – Inverloch.
- Wodonga – Alpine (7,366 small businesses). Of these, 31% were in Wodonga and West Wodonga, and 16% were in Bright – Mount Beauty.
2 Australian Bureau of Statistics, Regional Population, 2021-22, Accessed 15 January 2024
Table 1: Businesses in Victoria by size, 30 June 2023
Number of employees | Number of businesses in Greater Melbourne | Number of businesses in the rest of Victoria | Total number of businesses in Victoria1 |
Non-employing | 367,022 | 92,901 | 461,334 |
1-4 employees2 | 140,309 | 40,348 | 181,096 |
5-19 employees | 43,626 | 14,770 | 58,631 |
Small businesses | 550,957 | 148,019 | 701,061 |
20-99 employees | 11,920 | 3,122 | 15,338 |
100-199 employees | 1,135 | 213 | 1,514 |
200+ employees | 626 | 110 | 1,320 |
Total | 564,638 | 151,464 | 719,233 |
1 Includes businesses where information is only available at the state/territory level.
2 This includes a small number of businesses which have income tax withholding roles for purposes other than withholding amounts from wages and salaries (and as such have zero employment).
3Calculated by ASBFEO based on the ABS definition of small business of 0-19 employees.
Source: Based on Australian Bureau of Statistics, customised data, 2023.
Changes in small business numbers for Victoria
Chart 2: Annual change in the number of small businesses in Victoria
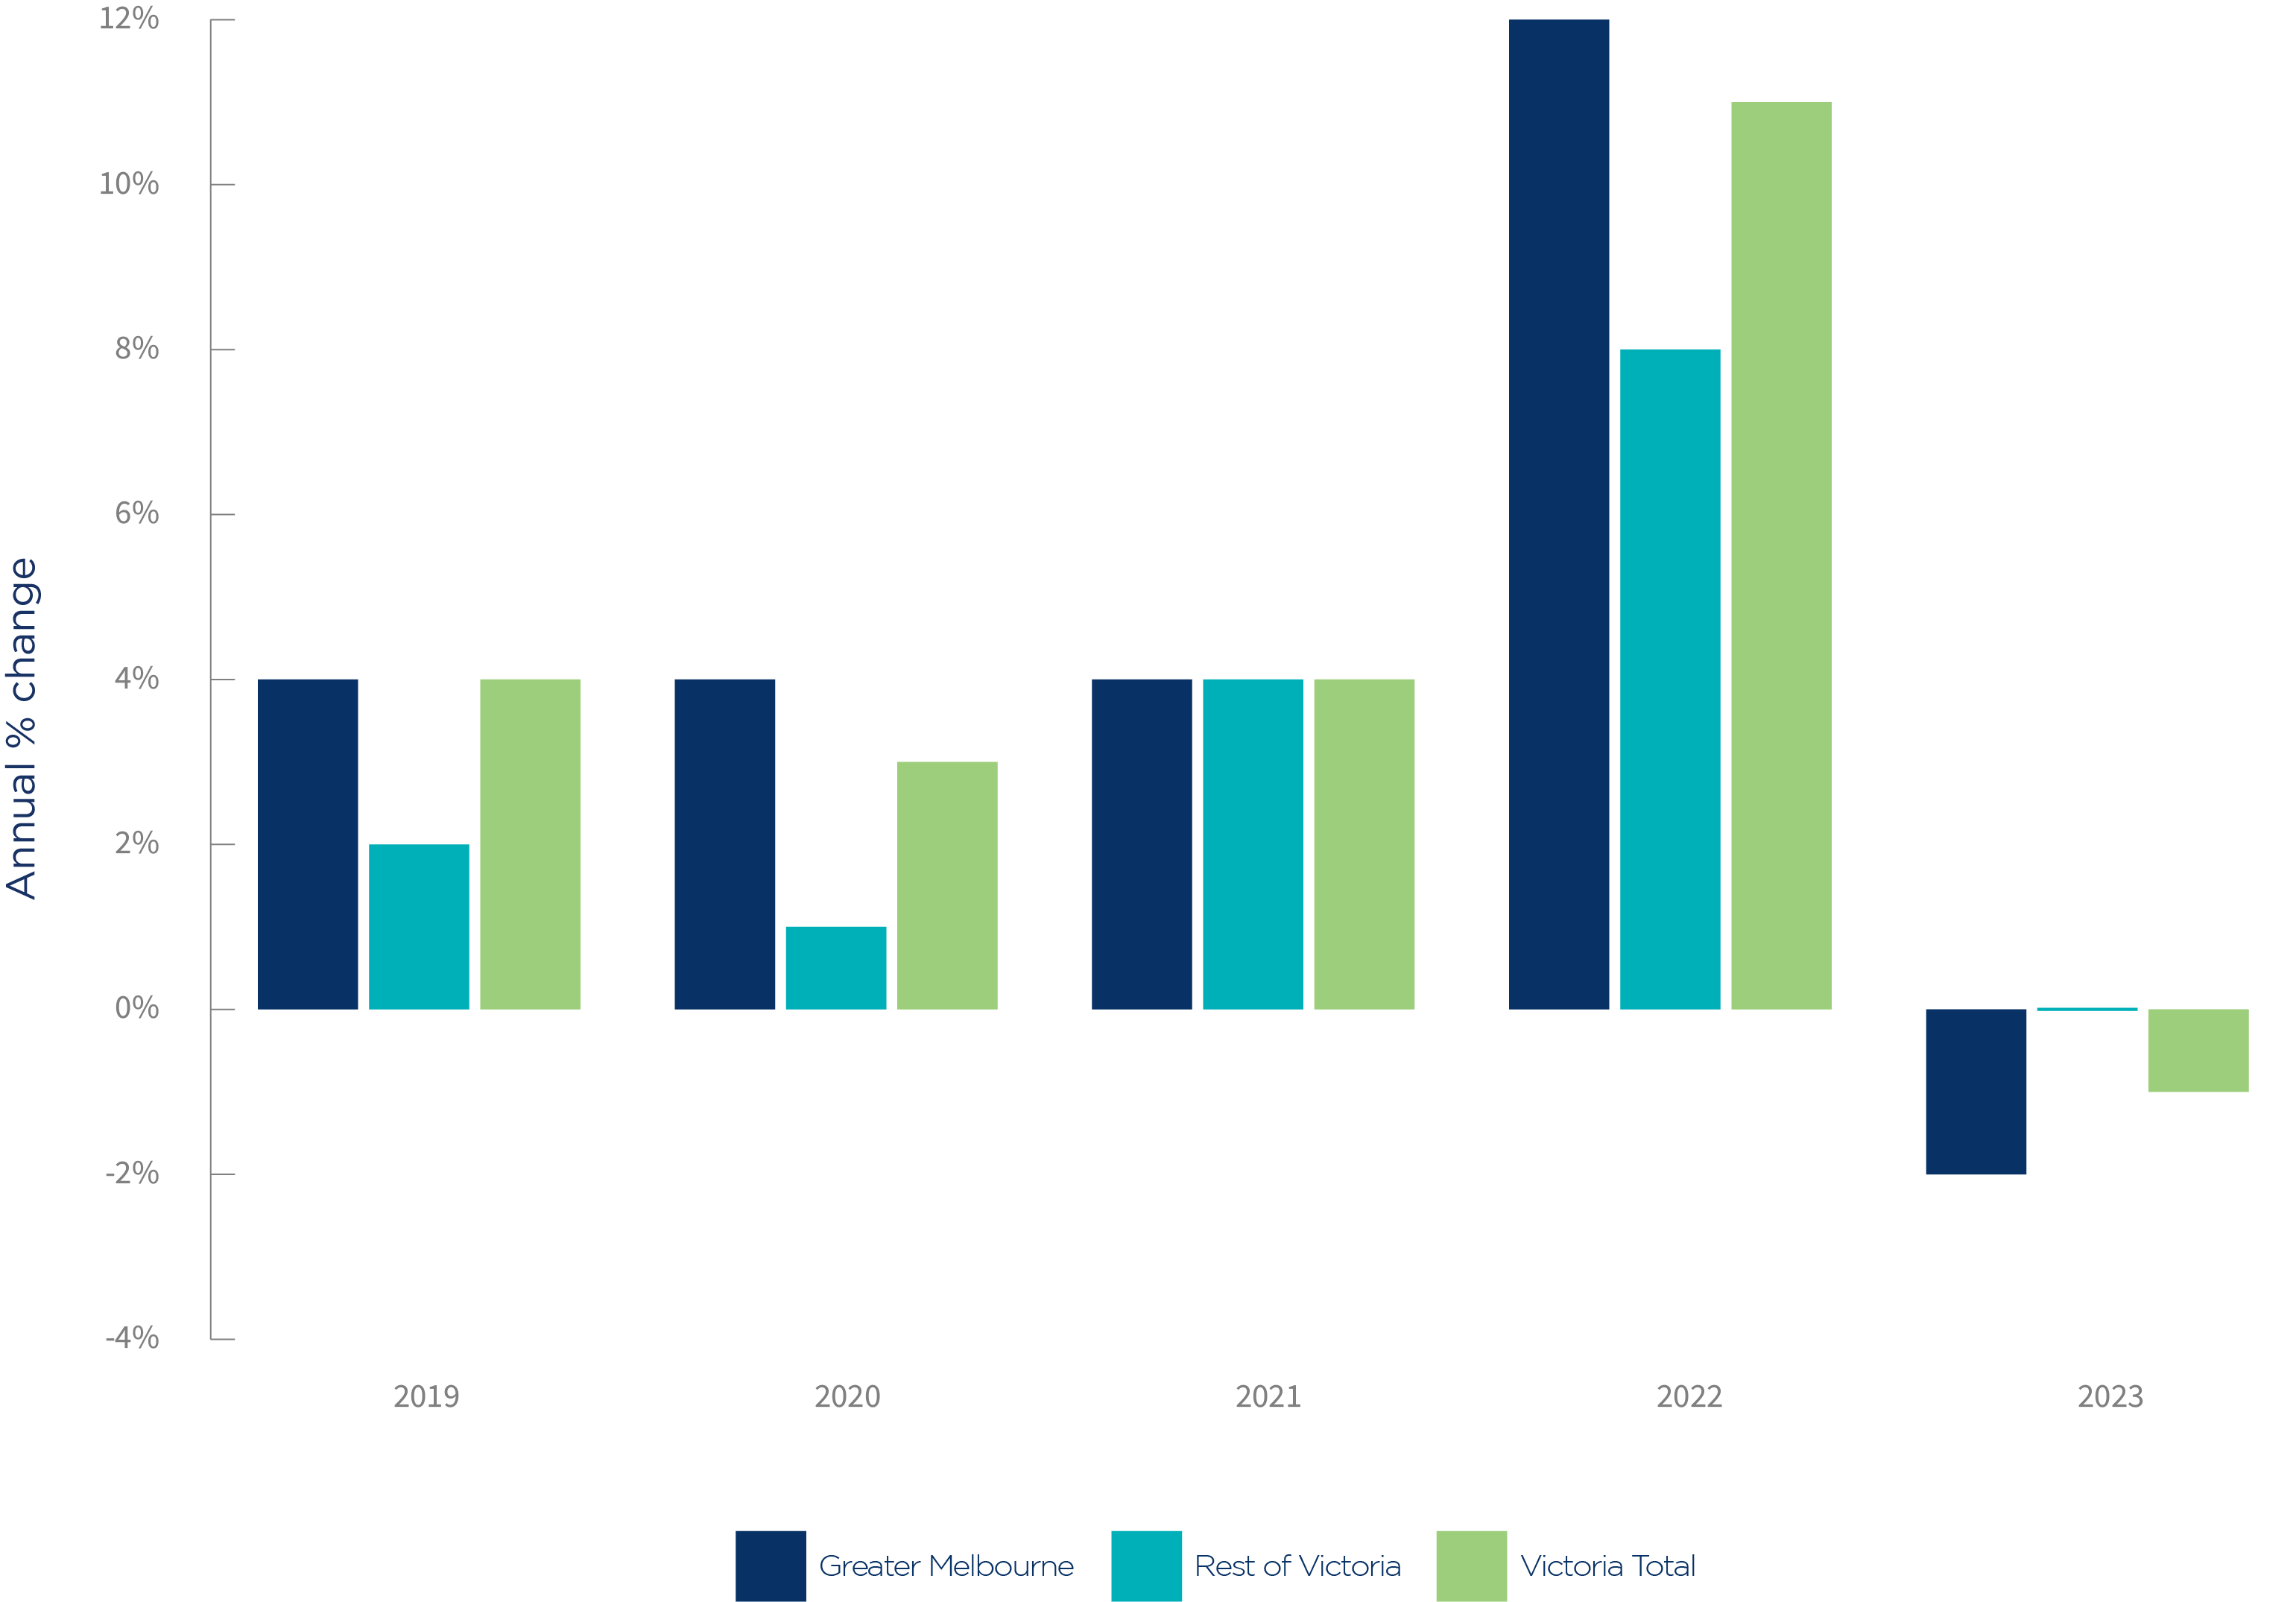
Total includes a small number of businesses where information is only available at the state/territory level.
Source: Based on Australian Bureau of Statistics, customised data, 2023.
A fall in the number of small businesses in Greater Melbourne drove the overall decrease in small businesses in Victoria in the year to 30 June 2023. This followed significant increases in the previous year.
The number of small businesses decreased by 10,001 (2%) in Greater Melbourne. The areas with the largest decrease in the number of small businesses were:
- Brimbank (decreased by 1,276 small businesses)
- Dandenong (decreased by 815 small businesses)
- Darebin – North (decreased by 680 small businesses).
The areas with the largest percentage decrease from the previous year were:
- Moreland – North (decreased by 8%)
- Darebin – North (decreased by 8%)
- Brimbank (decreased by 7%).
The number of small businesses in the rest of Victoria increased by 396 (0.3%) over the year to 30 June 2023. The areas with the largest increase in the number of small businesses were:
- Shepparton (increased by 218 small businesses)
- Ballarat (increased by 199 small businesses)
- Surf Coast – Bellarine Peninsula (increased by 169 small businesses).
The areas with the largest percentage increase from the previous year were:
- Shepparton (increased by 3%)
- Barwon – West (increased by 3%)
- Surf Coast – Bellarine Peninsula (increased by 2%).
There were 482,836 small businesses in Queensland on 30 June 2023, representing 19% of all Australian small businesses (compared to 20% of Australia’s population who are Queenslanders3).
Chart 1: Small business in Queensland, 30 June 2023
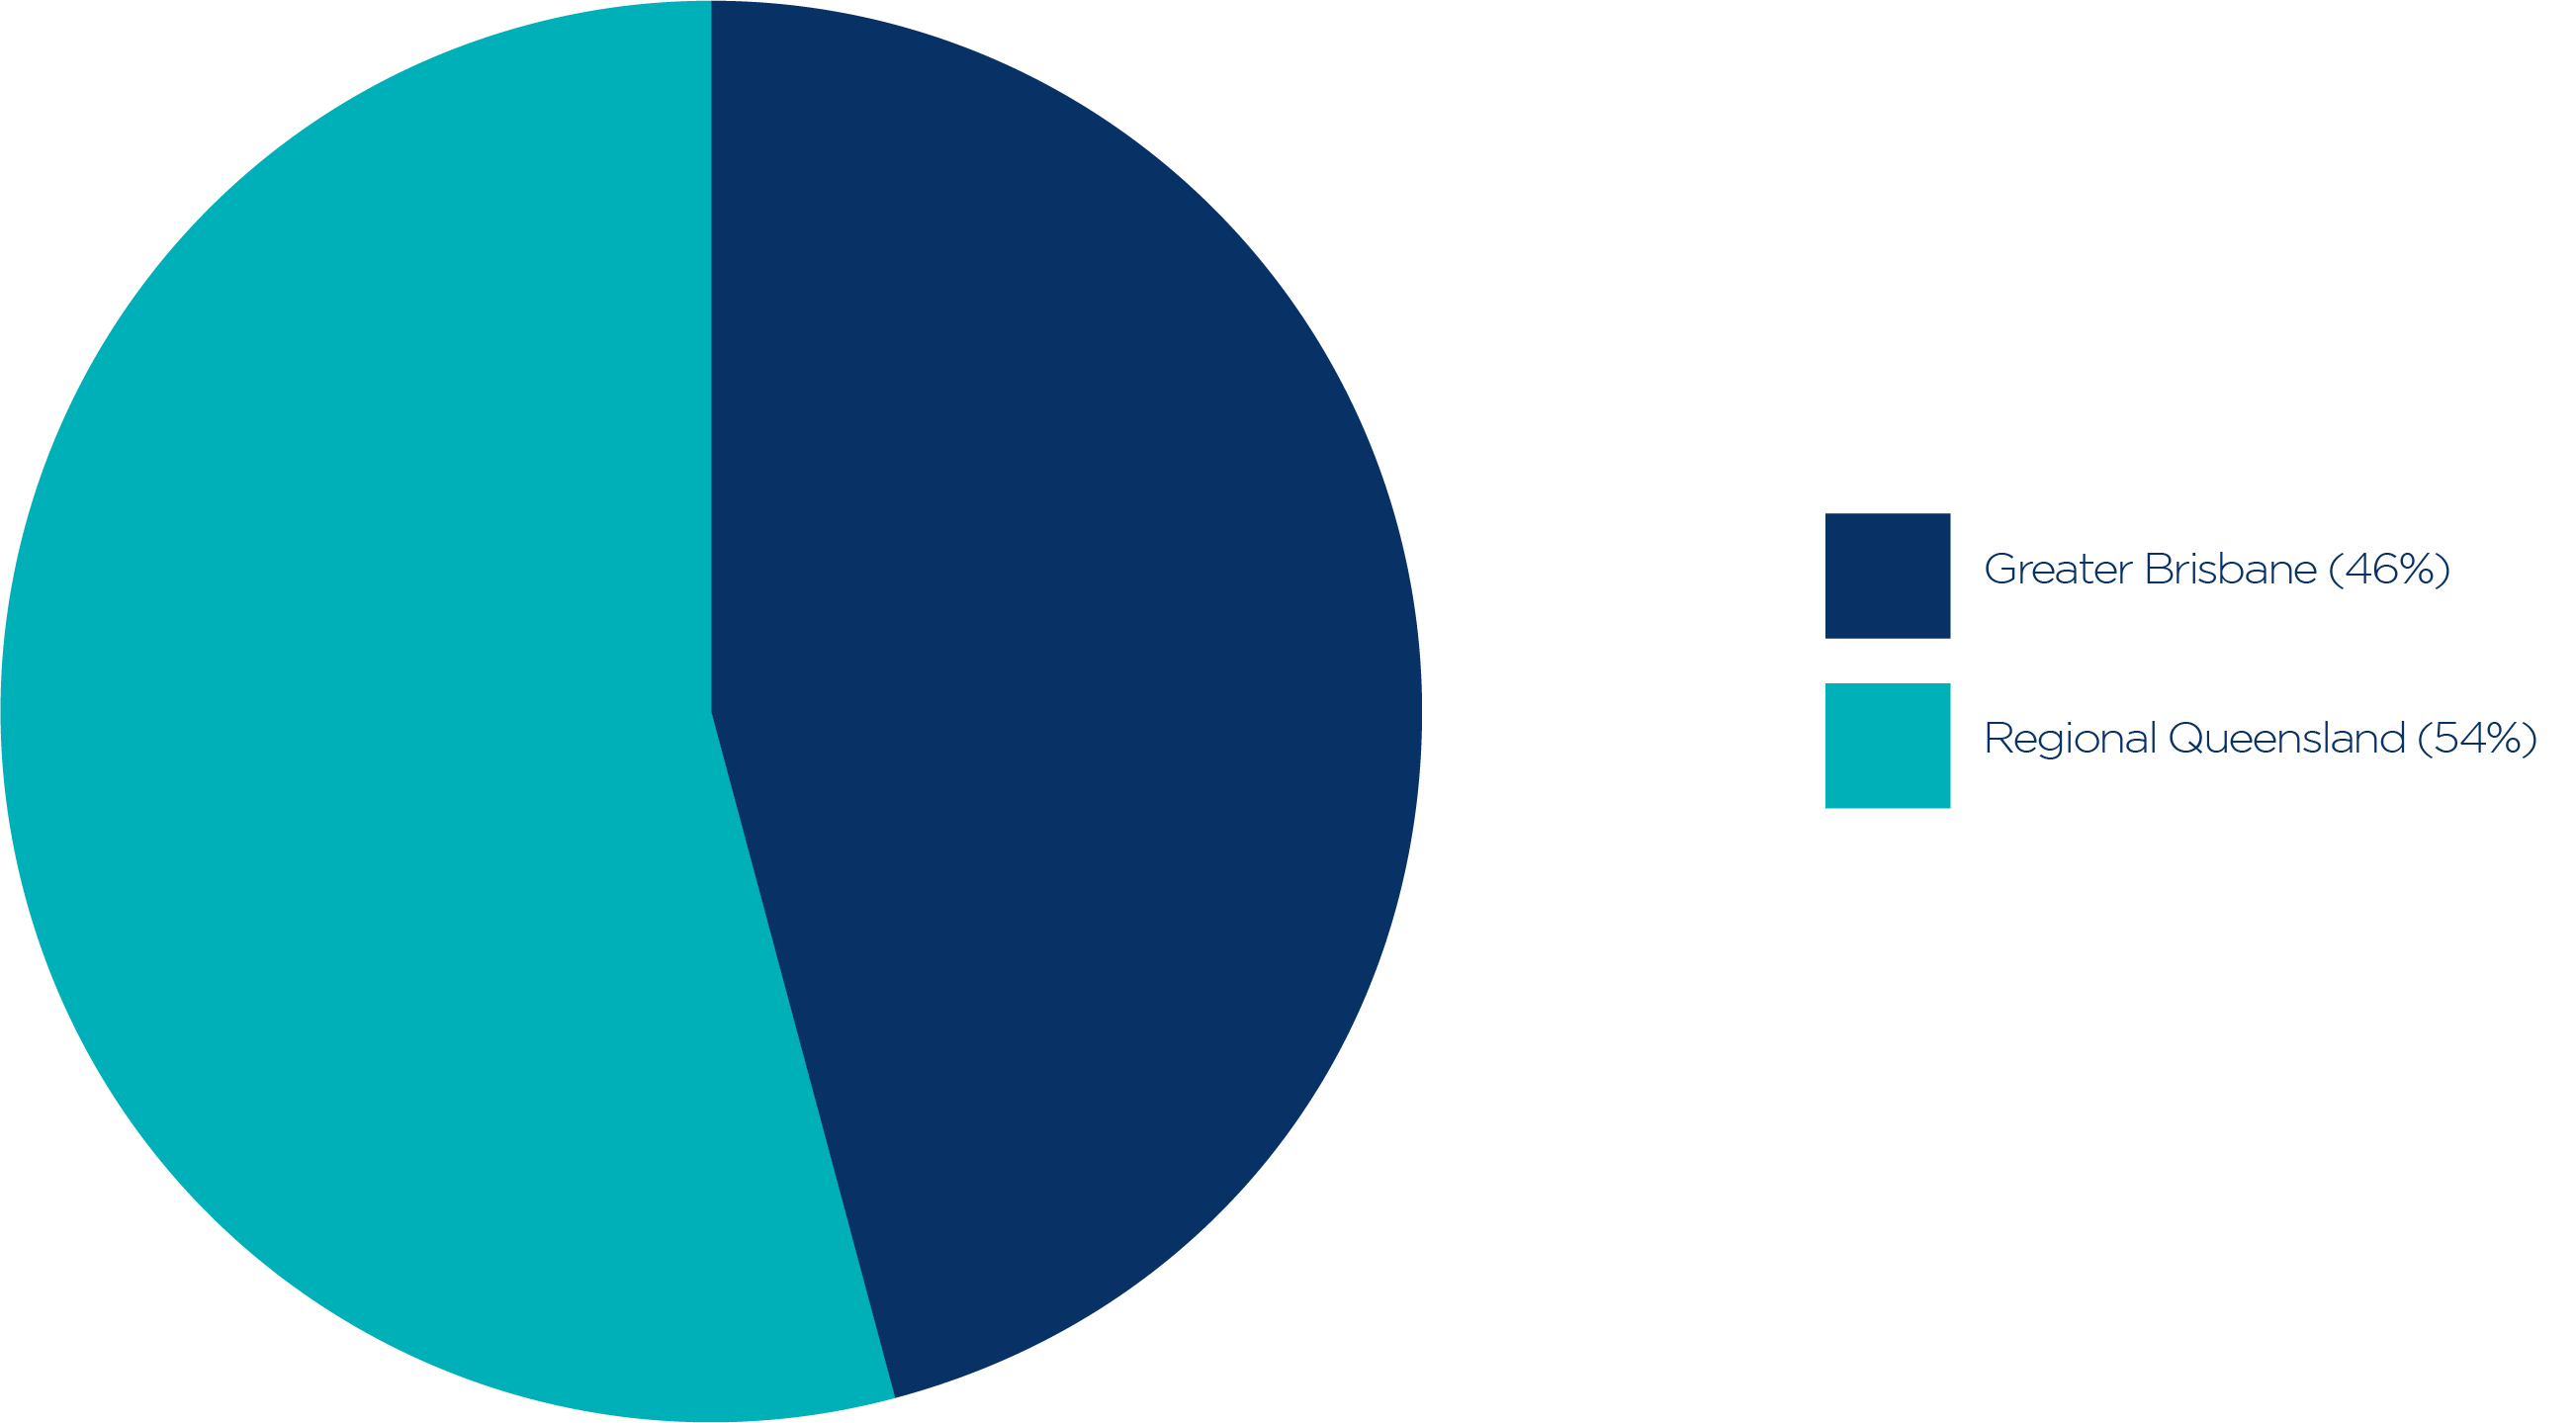
Source: Based on Australian Bureau of Statistics, customised data, 2022.
As shown above, 46% of Queensland’s small businesses were in the Greater Capital City region. This aligns with the population distribution, as around half of Queensland’s population resides outside of Greater Brisbane.
Greater Brisbane
In Greater Brisbane, there were 221,618 small businesses on 30 June 2023, representing 46% of all small businesses in Queensland. The areas with the highest number of small businesses were:
- Brisbane Inner (21,463 small businesses). Of these, 45% were in Brisbane City.
- Brisbane Inner – North (12,585 small businesses). Of these, 27% were in Newstead – Bowen Hills.
- Mt Gravatt (8,972 small businesses). Of these, 28% were in Eight Mile Plains.
- Brisbane Inner – West (8,215 small businesses). Of these, 36% were in Paddington – Milton.
- Holland Park – Yeronga (8,067 small businesses). Of these, 22% were in Coorparoo.
Regional Queensland
There were 259,631 small businesses in the rest of Queensland on 30 June 2023. These accounted for 54% of Queensland’s small businesses. The areas with the highest number of small businesses were:
- Ormeau – Oxenford (15,682 small businesses). Of these, 15% were in Hope Island and 14% were in Helensvale.
- Toowoomba (14,032 small businesses). Of these, 38% were in Toowoomba, Harlaxton and surrounds.
- Townsville (12,142 small businesses). Of these, 12% were in Townsville City – North Ward and 8% were in Garbutt – West End.
- Broadbeach – Burleigh (11,035 small businesses). Of these, 25% were in Mermaid Beach – Broadbeach and 25% were in Burleigh Heads.
- Mackay (10,302 small businesses). Of these, 25% were in Mackay and surrounds and 11% were in Seaforth – Calen.
3 Australian Bureau of Statistics, Regional Population, 2021-22, Accessed 15 January 2024
Table 1: Businesses in Queensland by size, 30 June 2023
Number of employees | Number of businesses in Greater Brisbane | Number of businesses in rest of Queensland | Total number of businesses in Queensland1 |
Non-employing | 136,806 | 161,980 | 299,843 |
1-4 employees2 | 63,392 | 71,640 | 135,390 |
5-19 employees | 21,420 | 26,011 | 47,603 |
Small businesses (0-19 employees)3 | 221,618 | 259,631 | 482,836 |
20-99 employees | 5,792 | 6,341 | 12,307 |
100-199 employees | 515 | 424 | 1,014 |
200+ employees | 271 | 226 | 845 |
Total | 228,196 | 266,622 | 497,002 |
1 Includes businesses where information is only available at the state/territory level.
2 This includes a small number of businesses which have income tax withholding roles for purposes other than withholding amounts from wages and salaries (and as such have zero employment).
3Calculated by ASBFEO based on the ABS definition of small business of 0-19 employees.
Source: Based on Australian Bureau of Statistics, customised data, 2023.
Changes to small businesses numbers for Queensland
Chart 2: Annual change in the number of small businesses in Queensland
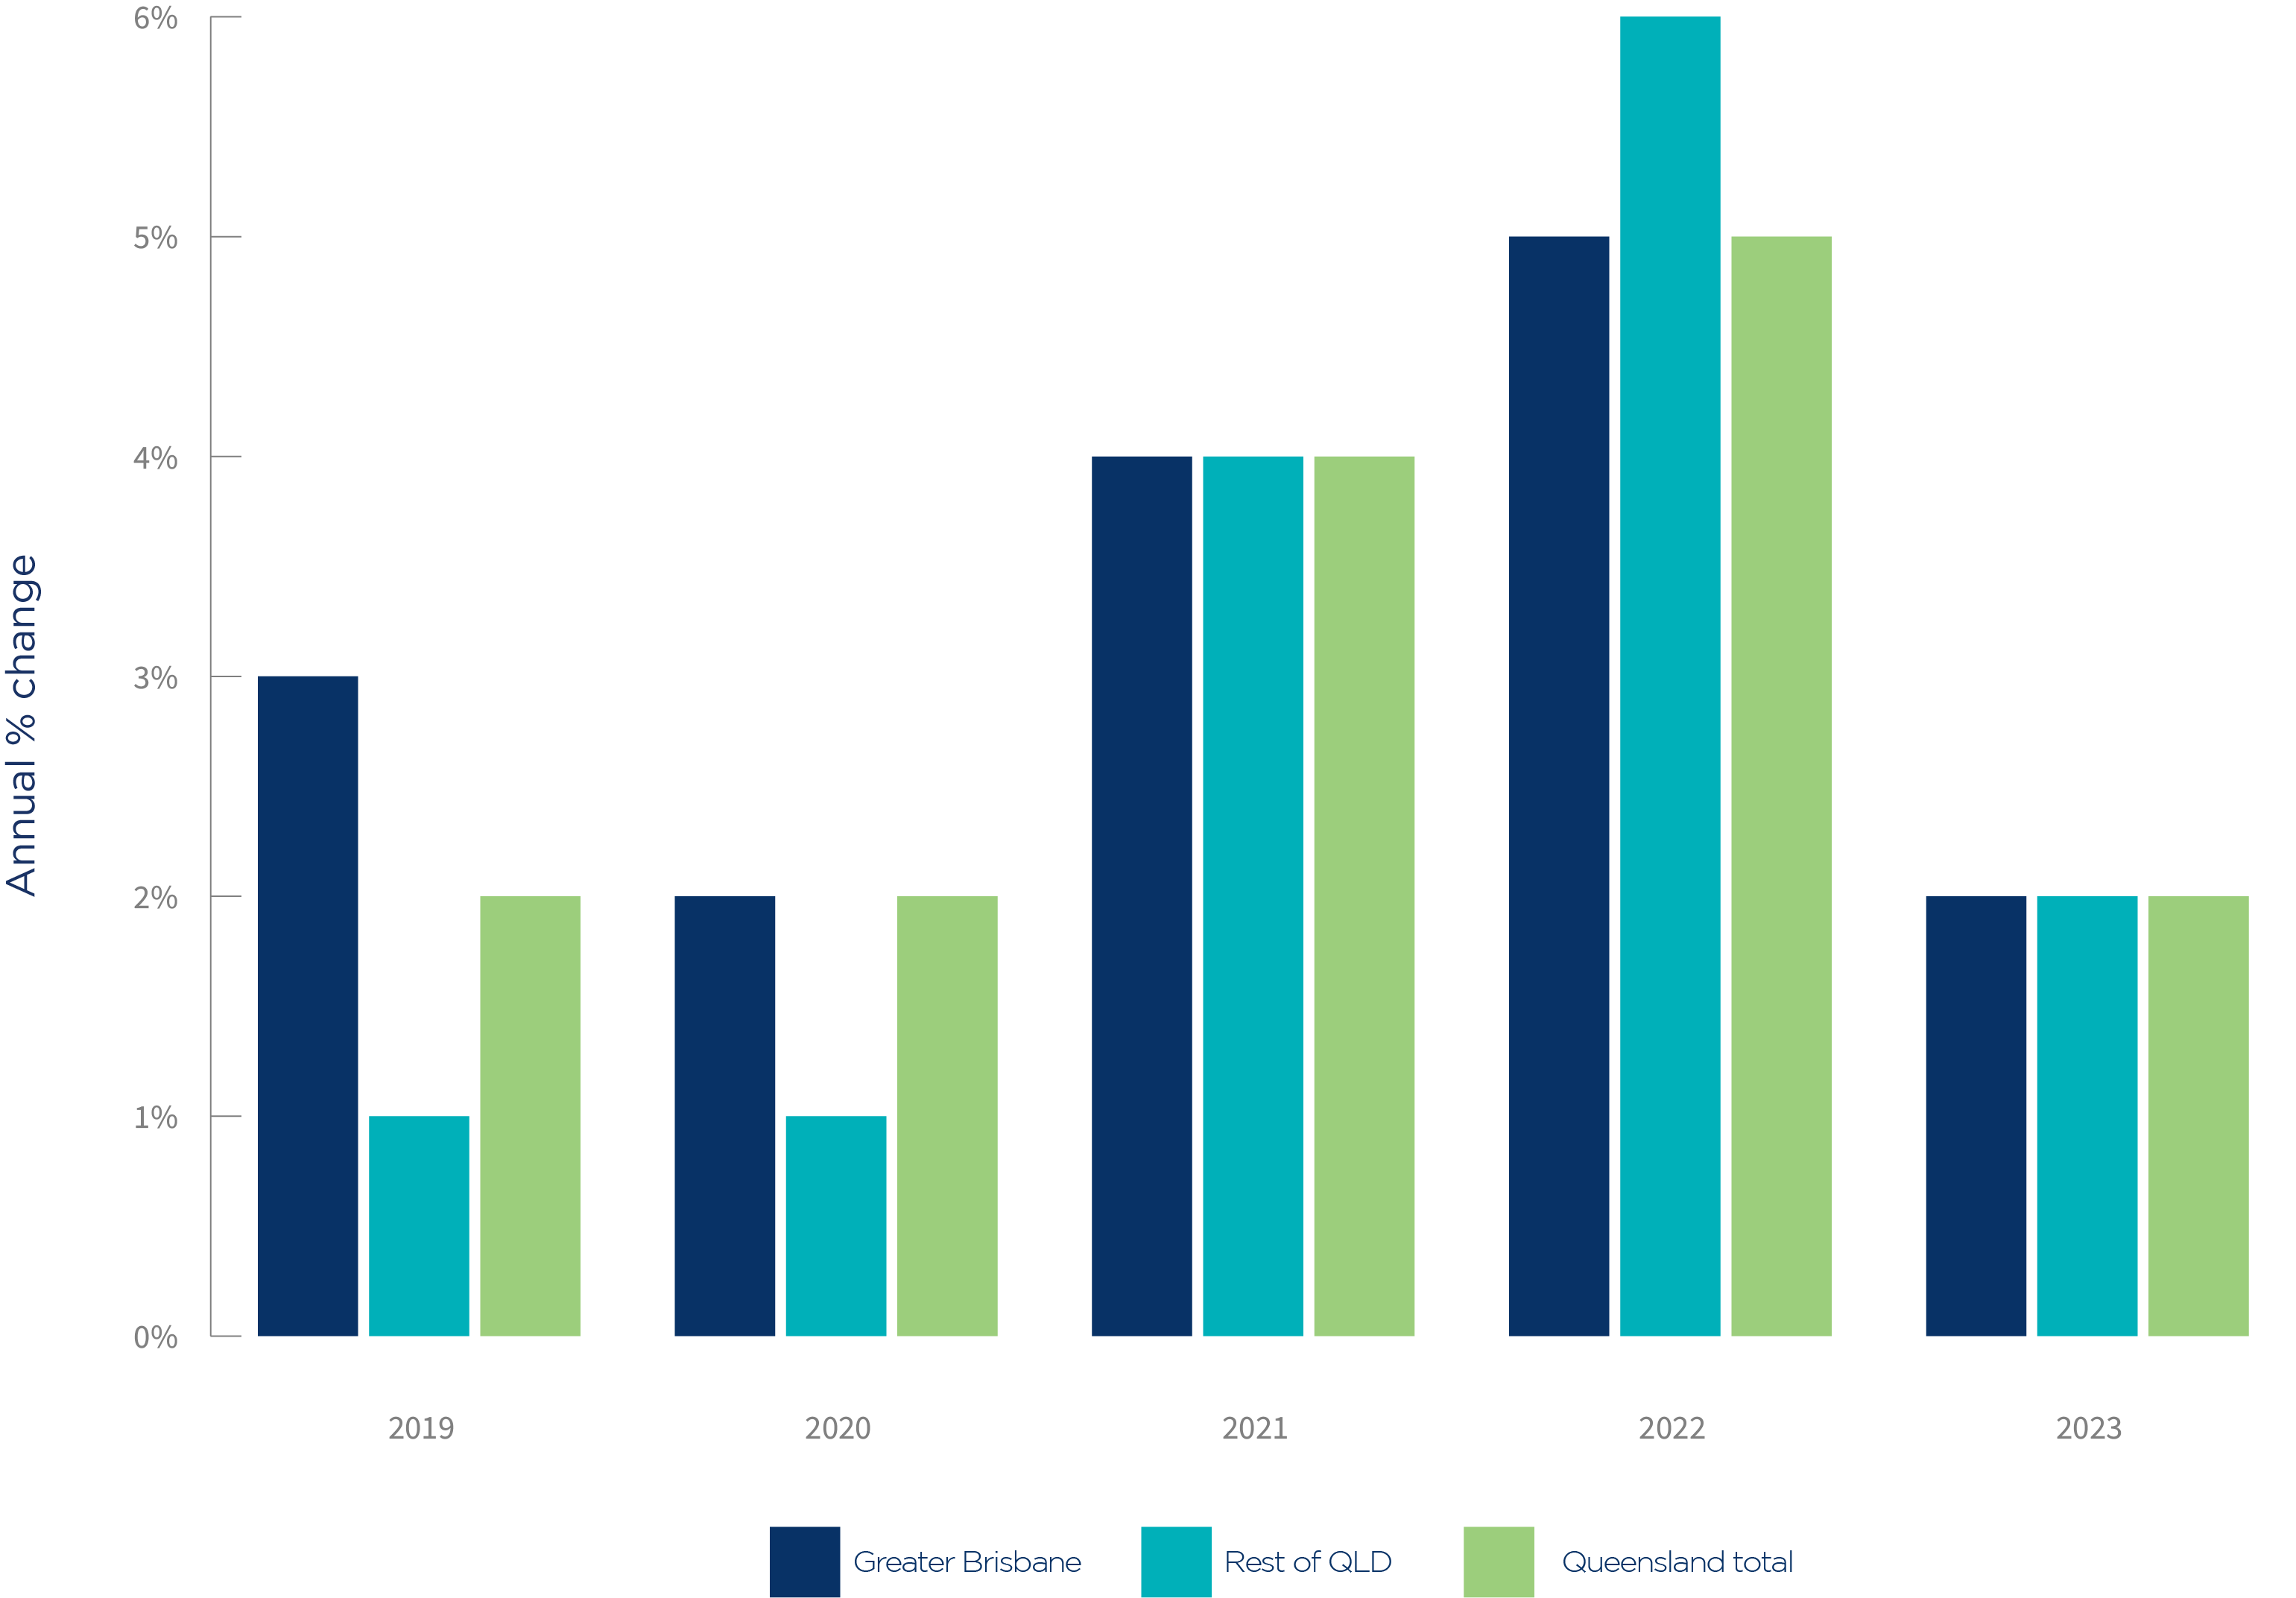
Total includes a small number of businesses where information is only available at the state/territory level.
Source: Based on Australian Bureau of Statistics, customised data, 2023.
The number of small businesses in Queensland increased 2% over the year to 30 June 2023. They increased by 4,345 (2%) in Greater Brisbane. The areas with the largest increase in the number of small businesses were:
- Browns Plains (increased by 418 small businesses)
- Brisbane Inner (increased by 414 small businesses)
- Ipswich Inner (increased by 287 small businesses).
The areas with the largest percentage increase from the previous year were:
- Browns Plains (increased by 7%)
- Jimboomba (increased by 6%)
- Springfield – Redbank (increased by 5%).
The number of small businesses in the rest of Queensland increased by 5,206 (2%) over the year to 30 June 2023. The areas with the largest increase in the number of small businesses were:
- Ormeau – Oxenford (increased by 665 small businesses)
- Toowoomba (increased by 478 small businesses)
- Mackay (increased by 320 small businesses).
The areas with the largest percentage increase from the previous year were:
- Sunshine Coast Hinterland (increased by 5%)
- Ormeau – Oxenford (increased by 4%)
- Gold Coast Hinterland (increased by 4%).
There were 155,221 small businesses in South Australia on 30 June 2023, representing 6% of all Australian small businesses (compared to 7% of the population living in South Australia4).
Chart 1: Small business in South Australia, 30 June 2023
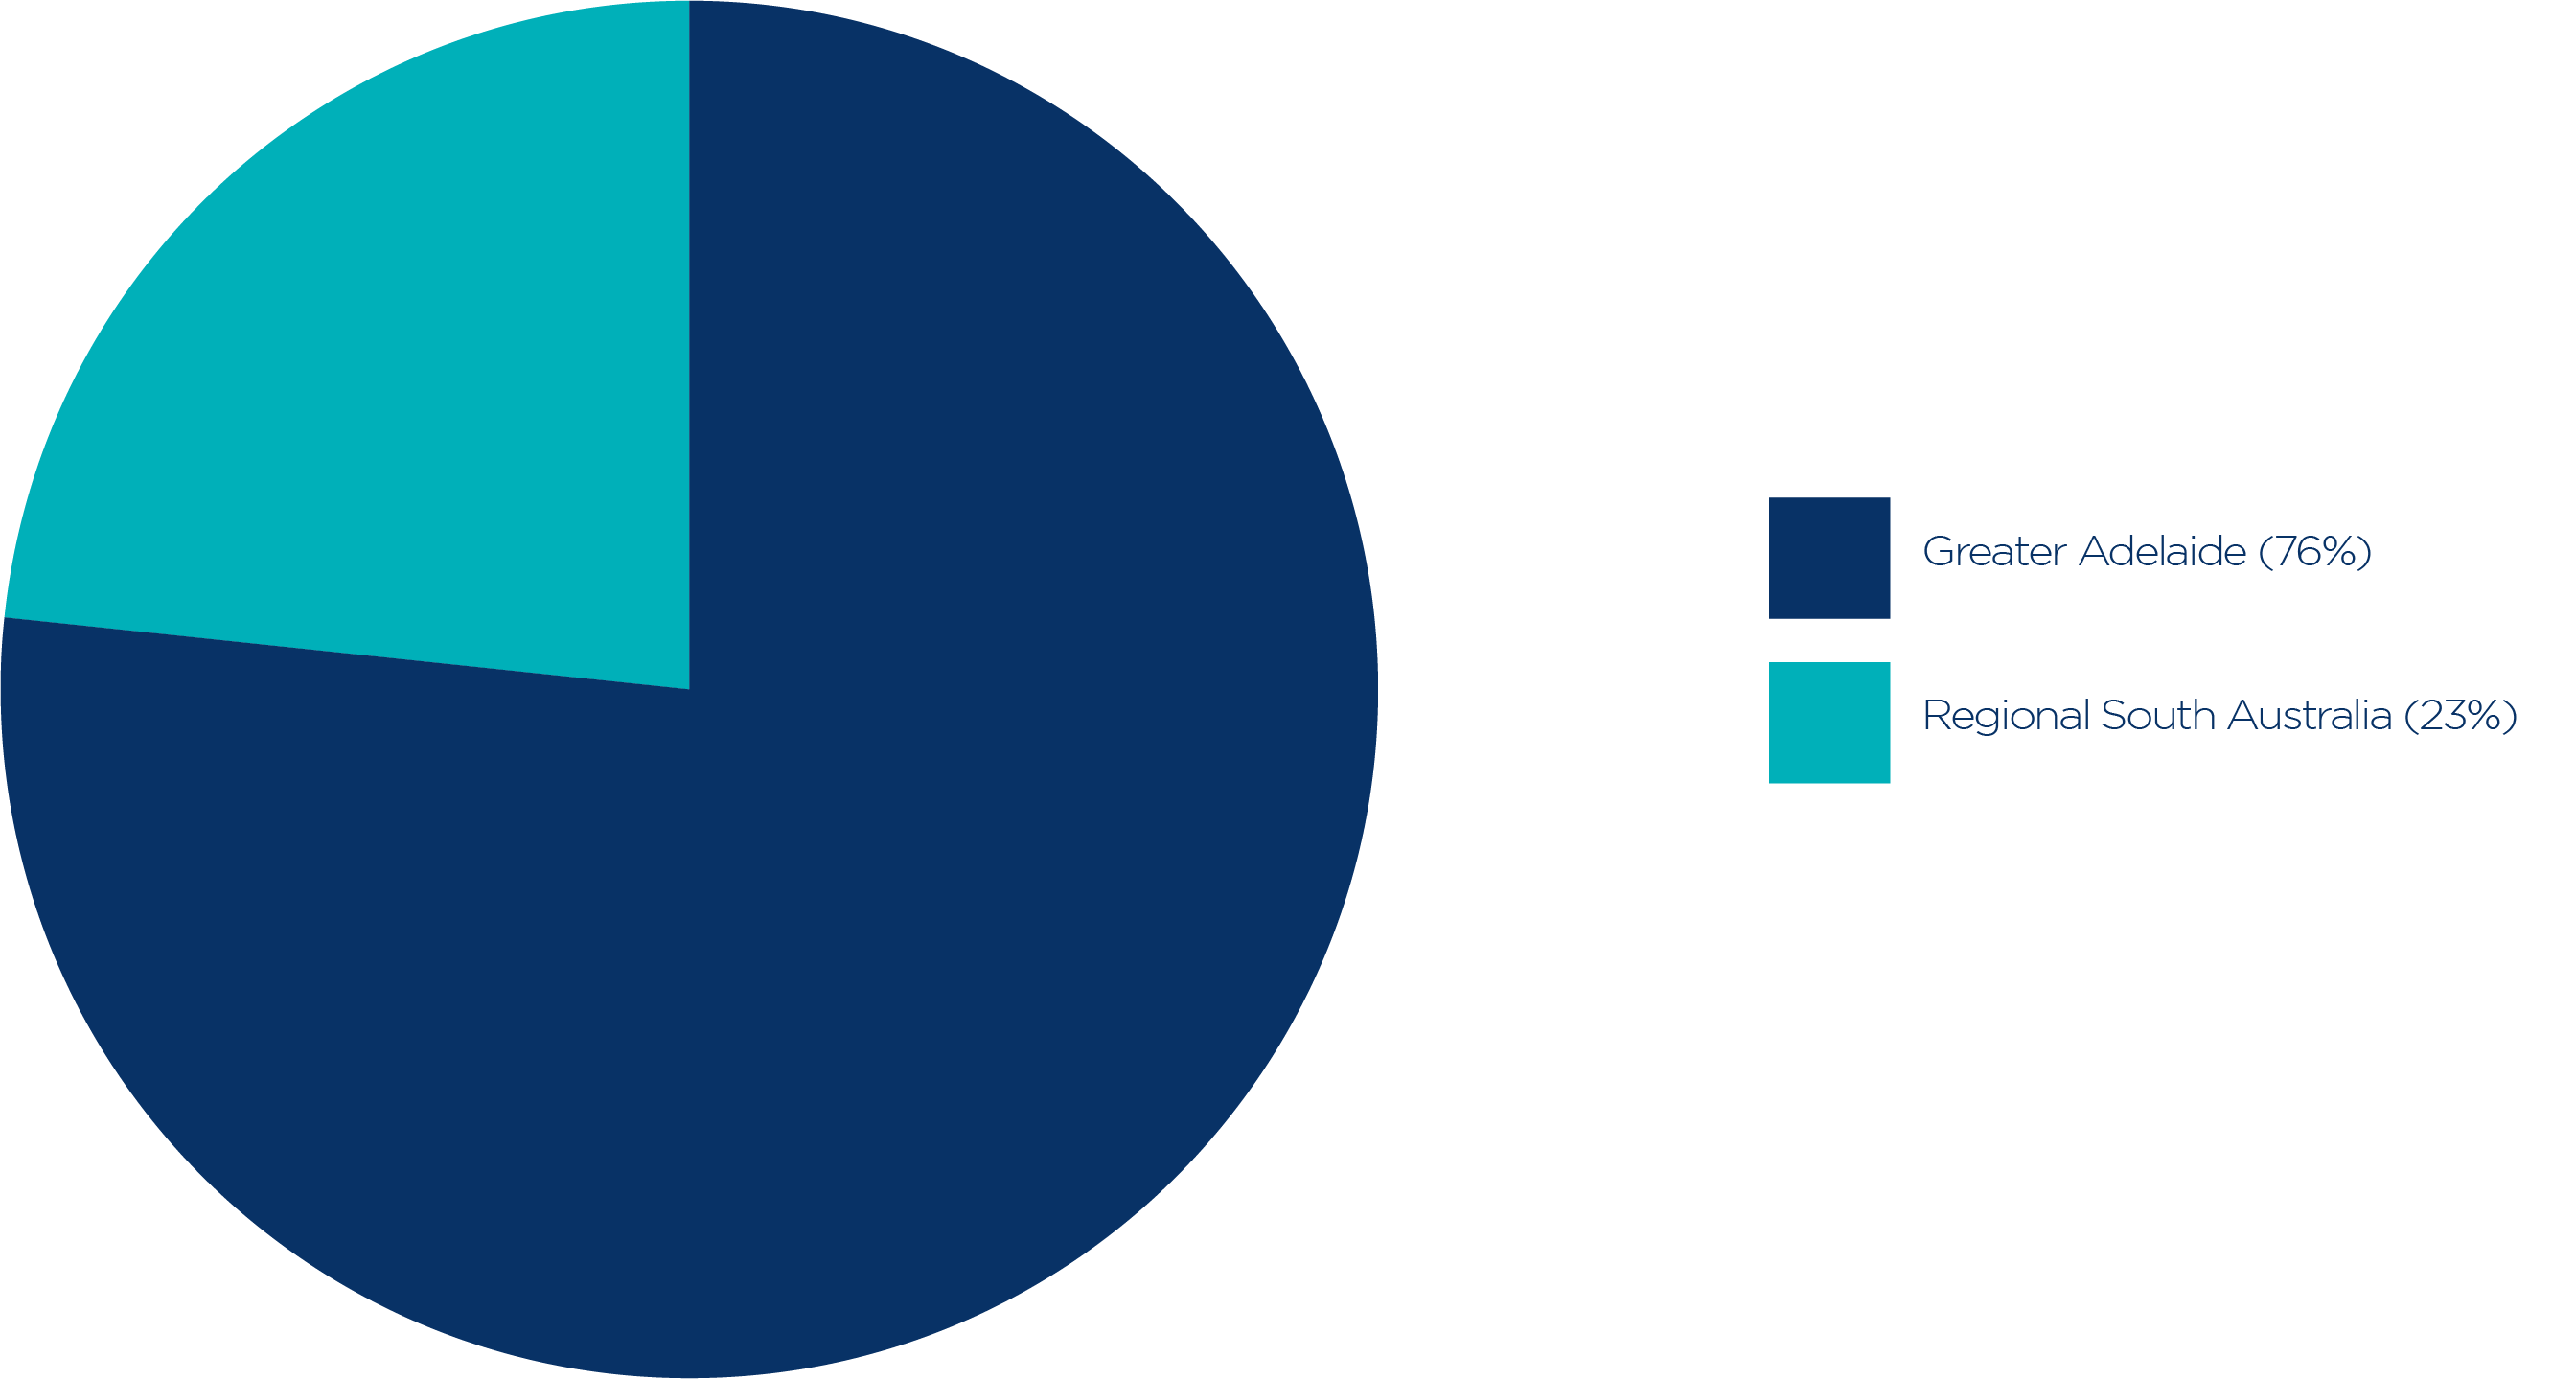
Total includes a small number of businesses where information is only available at the state/territory level.
Source: Based on Australian Bureau of Statistics, customised data, 2023.
Greater Adelaide
Over three quarters (76%) of South Australian small businesses were in Greater Adelaide on 30 June 2023. This is consistent with South Australia’s population distribution, as over three quarters of South Australians live in the Greater Adelaide area.
The Greater Adelaide areas with the highest number of small businesses were:
- Adelaide City (12,024 small businesses). Of these, 87% were in Adelaide
- Onkaparinga (9,845 small businesses). Of these, 10% were in McLaren Vale and 8% were in Aldinga.
- Charles Sturt (9,527 small businesses). Of these, 19% were in Hindmarsh – Brompton.
- Salisbury (8,684 small businesses). Of these, 15% were in Mawson Lakes – Globe Derby Park and 12% were in Parafield Gardens.
- Adelaide Hills (7,342 small businesses). Of these, 25% were in Aldgate – Stirling.
Regional South Australia
There were 36,404 small businesses in the rest of South Australia, accounting for 23% of South Australia’s small businesses on 30 June 2023. The highest number of small businesses were in:
- Limestone Coast (7,563 small businesses). Of these, 30% were in Mount Gambier and surrounds and 14% were in Tatiara.
- Murray and Mallee (6,569 small businesses). Of these, 15% were in Murray Bridge and 11% were in The Coorong.
- Eyre Peninsula and South West (4,960 small businesses). Of these, 32% were in Port Lincoln.
- Fleurieu – Kangaroo Island (4,800 small businesses). Of these, 33% were in Strathalbyn and surrounds and 21% were in Victor Harbor.
- Barossa (3,619 small businesses). Of these, 26% were in Light.
4 Australian Bureau of Statistics, Regional Population, 2021-22, Accessed 15 January 2024
Table 1: Businesses in South Australia by size, 30 June 2023
Number of employees | Number of businesses in Greater Adelaide | Number of businesses in the rest of South Australia | Total number of businesses in South Australia1 |
Non-employing | 80,353 | 23,052 | 103,720 |
1-4 employees2 | 26,896 | 9,411 | 36,407 |
5-19 employees | 11,095 | 3,941 | 15,094 |
Small businesses (0-19 employees)3 | 118,344 | 36,404 | 155,221 |
20-99 employees | 2,982 | 691 | 3,759 |
100-199 employees | 221 | 35 | 302 |
200+ employees | 157 | 13 | 271 |
Total | 121,704 | 37,143 | 159,553 |
1 Includes businesses where information is only available at the state/territory level.
2 This includes a small number of businesses which have income tax withholding roles for purposes other than withholding amounts from wages and salaries (and as such have zero employment).
3Calculated by ASBFEO based on the ABS definition of small business of 0-19 employees.
Source: Based on Australian Bureau of Statistics, customised data, 2023.
Changes in small businesses numbers for South Australia
Chart 2: Annual change in the number of small businesses in South Australia
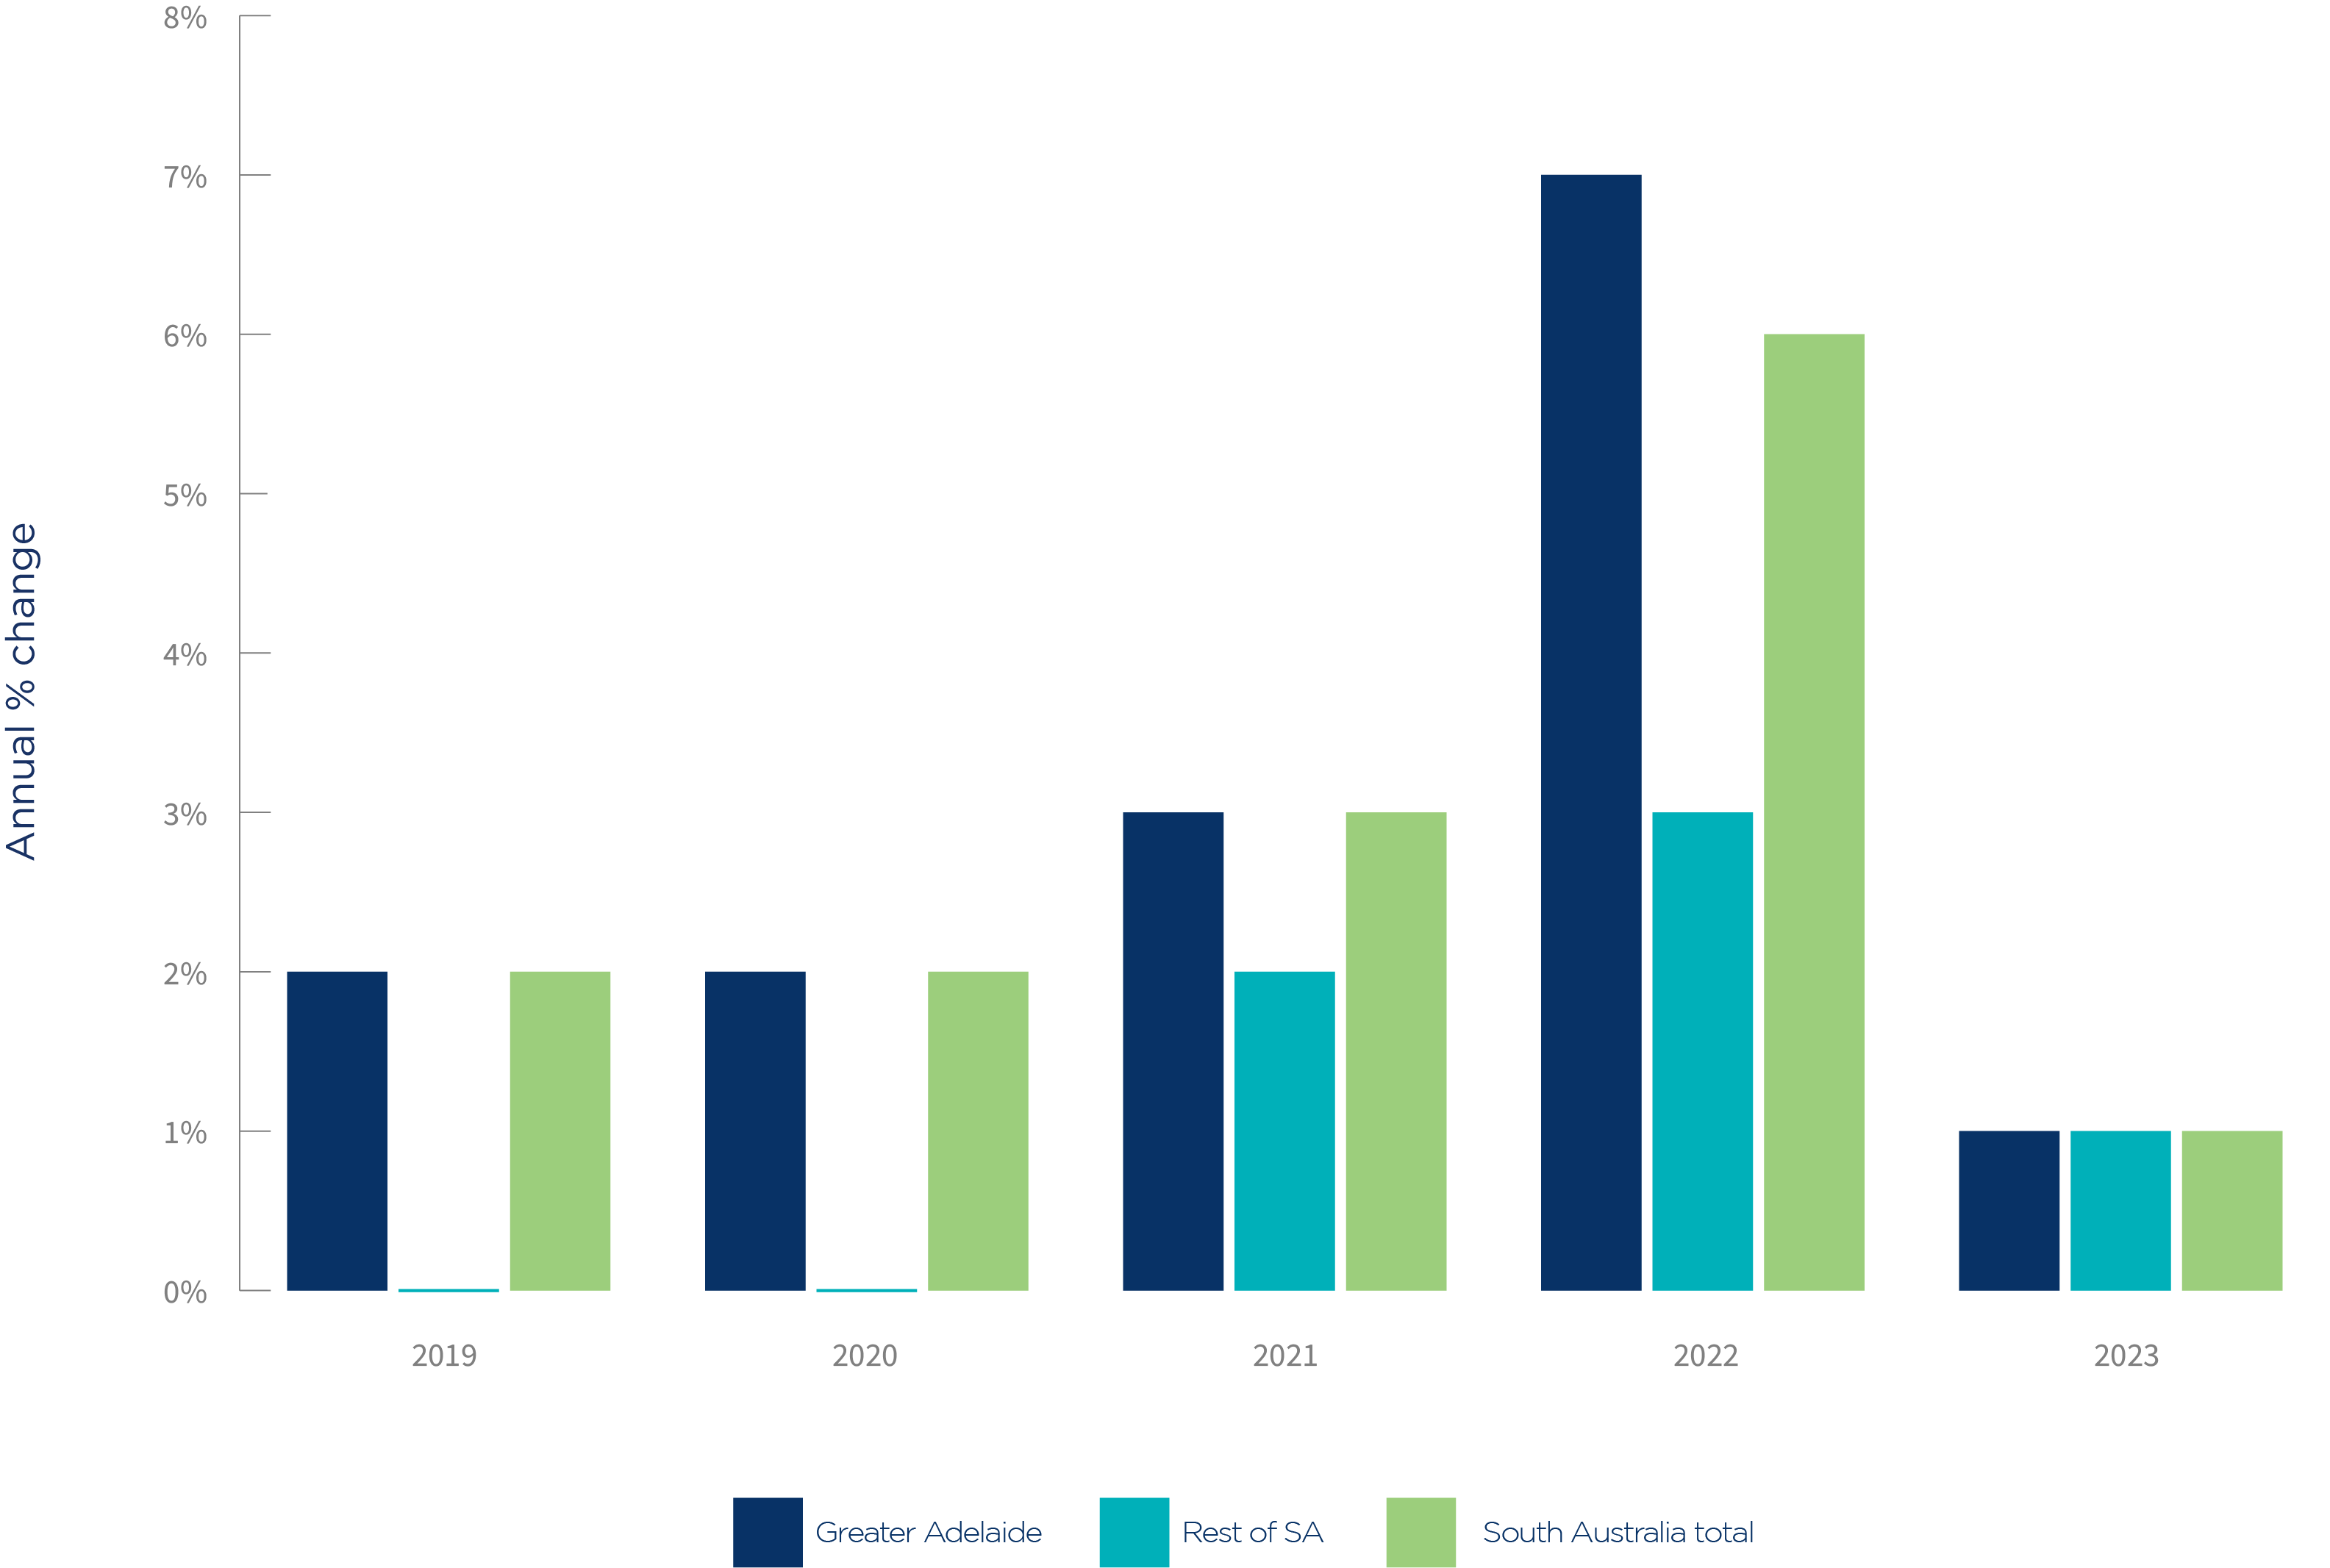
Total includes a small number of businesses where information is only available at the state/territory level.
Source: Based on Australian Bureau of Statistics, customised data, 2022.
There was a 1% increase in the number of small businesses in South Australia in the year to 30 June 2023. They increased by 1,103 (1%) in Greater Adelaide. The areas with the largest increase in the number of small businesses were:
- Port Adelaide – East (increased by 321 small businesses).
- Adelaide City (increased by 227 small businesses)
- Salisbury (increased by 224 small businesses).
The areas with the largest increase by percent from the year prior were:
- Port Adelaide – East (increased by 5%)
- Prospect – Walkerville (increased by 3%)
- Campbelltown (SA) (increased by 3%).
The number of small businesses in the rest of South Australia increased by 285 (1%) over the year to 30 June 2023. The areas with the largest increase in the number of small businesses were:
- Fleurieu – Kangaroo Island (increased by 123 small businesses)
- Outback – North and East, including Port Augusta (increased by 84 small businesses)
- Limestone Coast (increased by 51 small businesses).
The areas with the largest percentage increase from the previous year were:
- Outback – North and East, including Port Augusta (increased by 7%)
- Fleurieu – Kangaroo Island (increased by 3%)
- Mid North, including Peterborough – Mount Remarkable and Port Pirie (increased by 2%).
There were 238,907 small businesses in Western Australia on 30 June 2023, representing 9% of all Australian small businesses and in proportion with 11% of Australians living in the west[1].
Chart 1: Small businesses in Western Australia, 30 June 2023
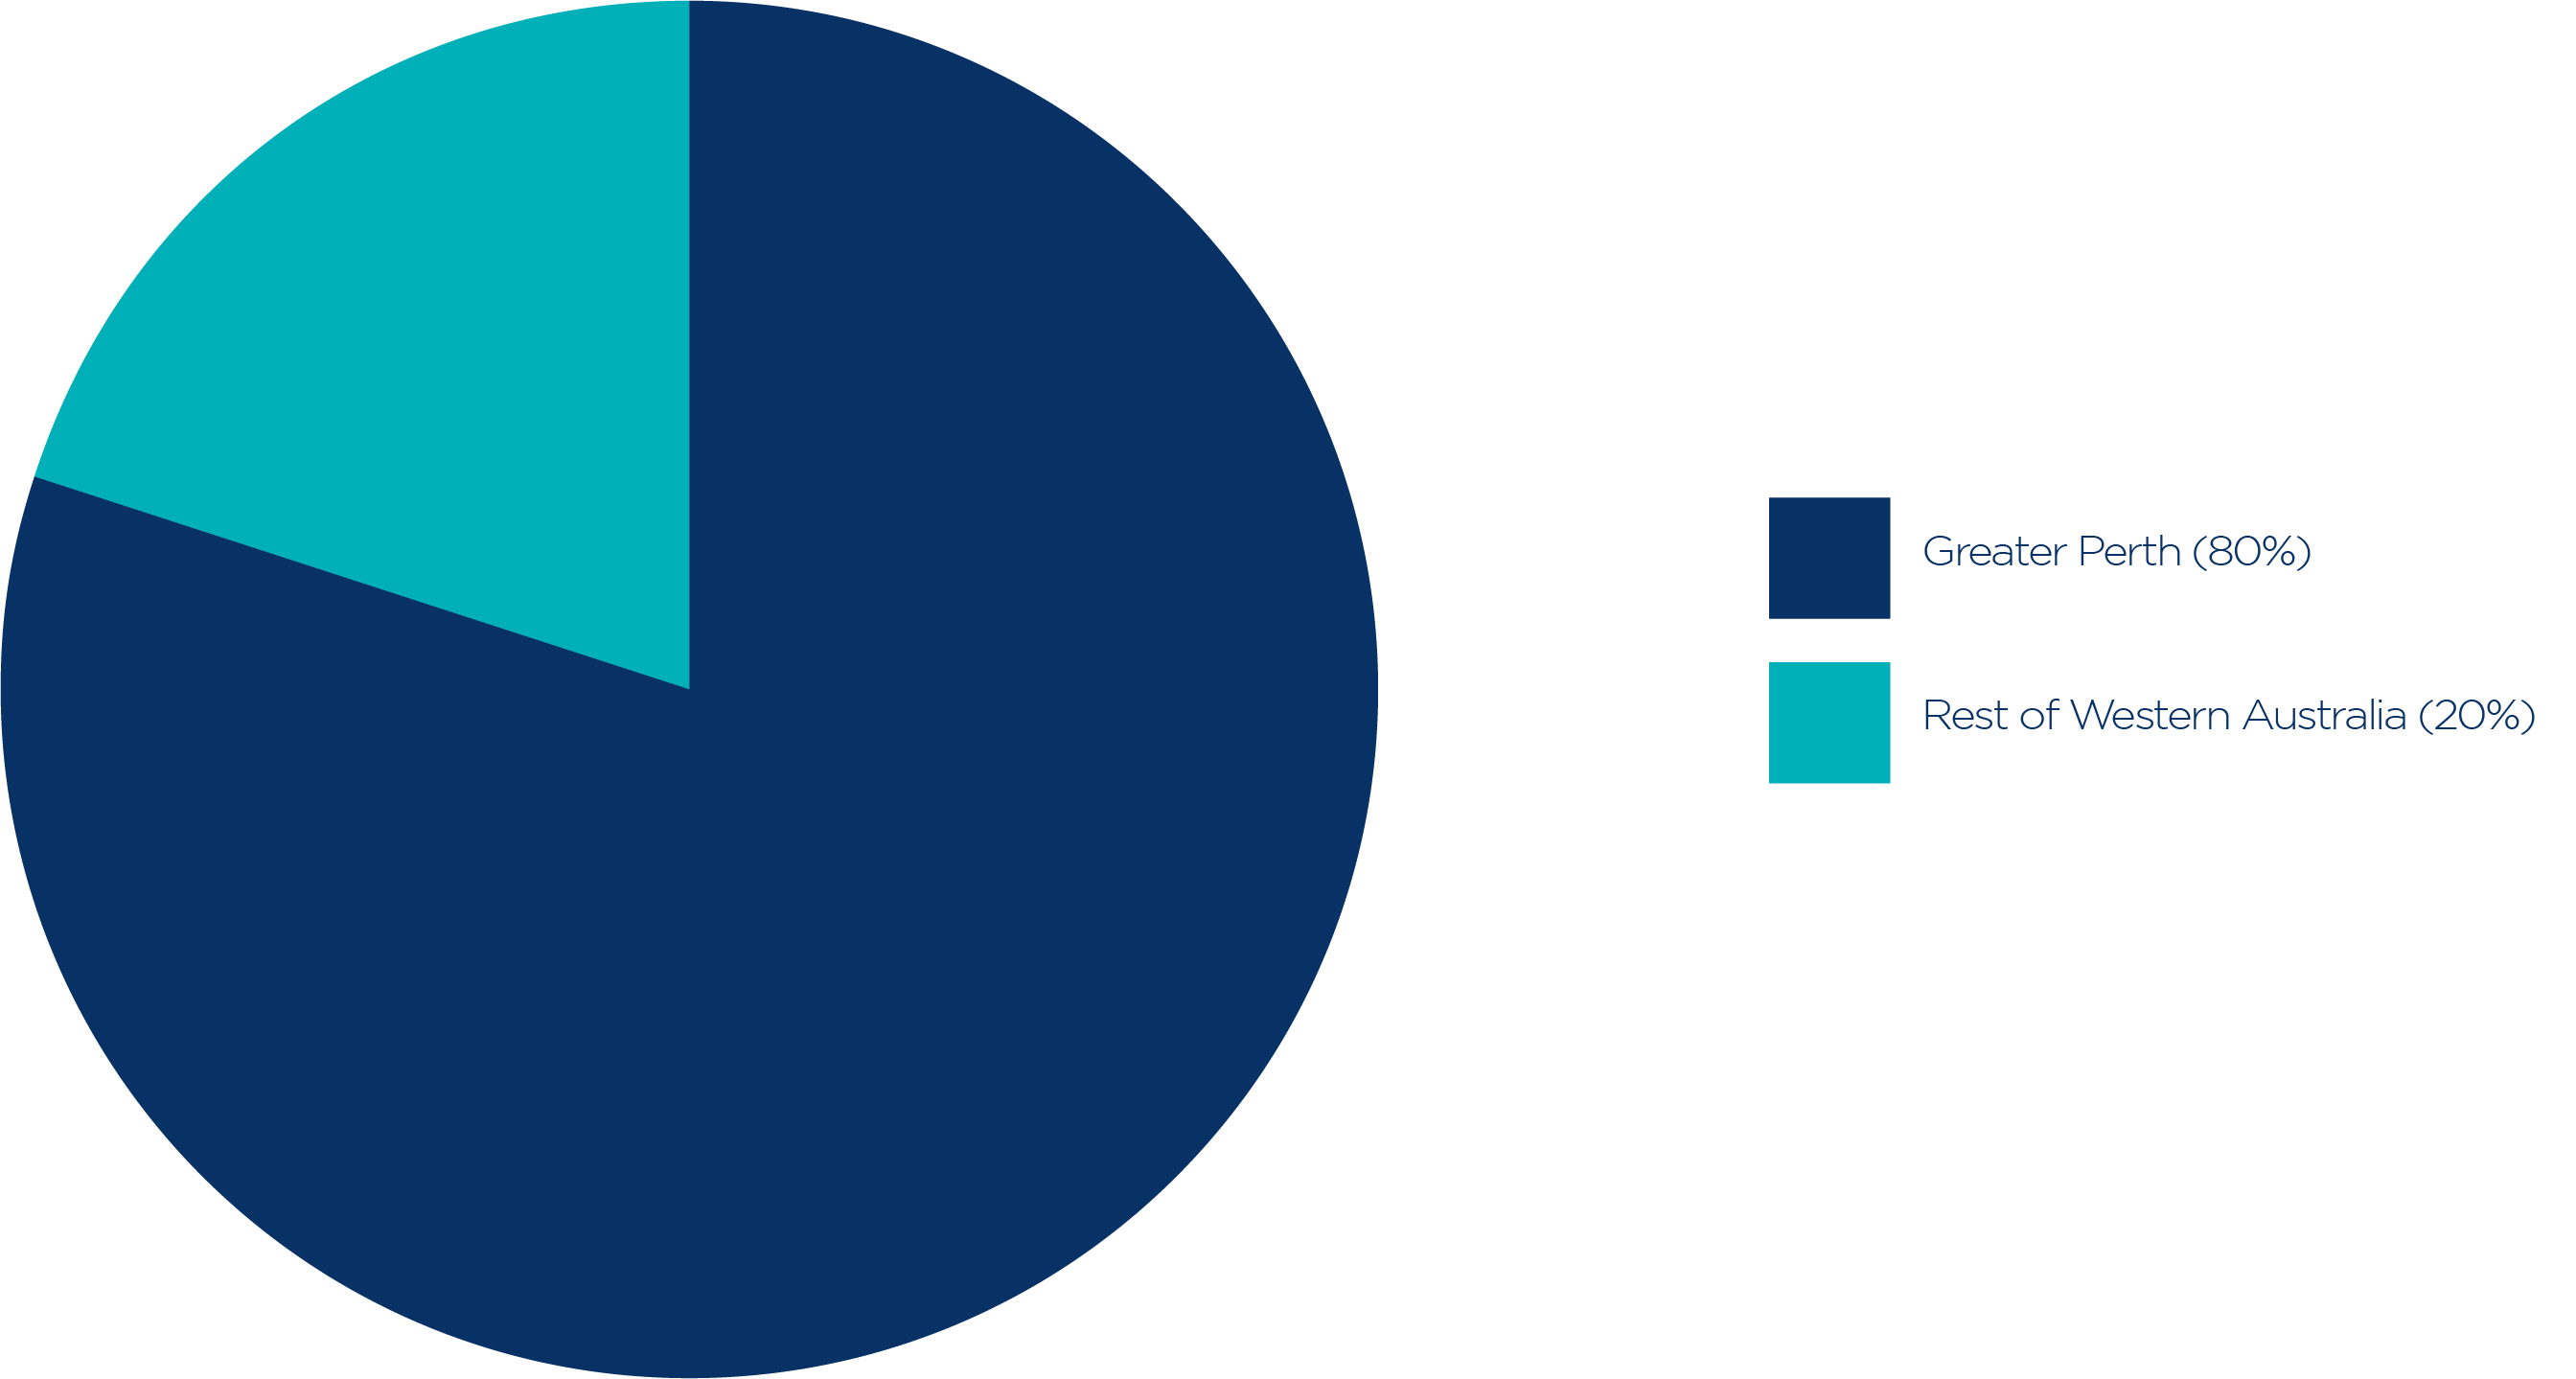
Source: Based on Australian Bureau of Statistics, customised data, provided in 2023.
Greater Perth
There were 190,679 small businesses in Greater Perth on 30 June 2023, representing 80% of Western Australia’s small businesses. Similarly, 80% of Western Australians live in Perth and its surrounds.
The Greater Perth areas with the highest number of small businesses were:
- Perth City (25,532 small businesses). Of these, 38% were in Perth (West) – Northbridge.
- Stirling (21,176 small businesses). Of these, 10% were in Osborne Park Industrial and 10% were in Stirling – Osborne Park.
- Wanneroo (14,468 small businesses). Of these, 19% were in Madeley – Darch.
- Joondalup (12,506 small businesses). Of these, 12% were in Joondalup – Edgewater and 10% were in Duncraig.
- Swan (11,875) small businesses. Of these, 15% were in Malaga.
Regional Western Australia
There were 47,632 small businesses in the rest of Western Australia on 30 June 2023. These accounted for 20% of Western Australia’s small businesses. The highest number of small businesses were in:
- Albany (7,072 small businesses). Of these, 23% were in Albany and 13% were in Kojonup.
- Bunbury (7,034 small businesses). Of these, 23% were in Bunbury South and 12% were Harvey.
- Wheat Belt – North (6,569 small businesses). Of these, 17% were in Gingin – Dandaragan.
- Augusta – Margaret River – Busselton (6,456 small businesses). Of these, 66% were in Busselton and surrounds.
- Mid West (4,707 small businesses). Of these, 58% were in Geraldton and surrounds.
Table 1: Businesses in Western Australia by size, 30 June 2023
Number of employees | Number of businesses in Greater Perth | Number of businesses in rest of Western Australia | Total number of businesses in Western Australia1 |
Non-employing | 125,236 | 29,295 | 154,847 |
1-4 employees2 | 47,140 | 12,879 | 60,196 |
5-19 employees | 18,303 | 5,458 | 23,864 |
Small businesses | 190,679 | 47,632 | 238,907 |
20-99 employees | 5,226 | 1,306 | 6,666 |
100-199 employees | 422 | 56 | 546 |
200+ employees | 279 | 39 | 542 |
Total | 196,606 | 49,033 | 246,661 |
1 Includes businesses where information is only available at the state/territory level.
2 This includes a small number of businesses which have income tax withholding roles for purposes other than withholding amounts from wages and salaries (and as such have zero employment).
3Calculated by ASBFEO based on the ABS definition of small business of 0-19 employees.
Source: Based on Australian Bureau of Statistics, customised data, 2023.
Changes in small businesses numbers for Western Australia
Chart 2: Annual change in the number of small businesses in Western Australia
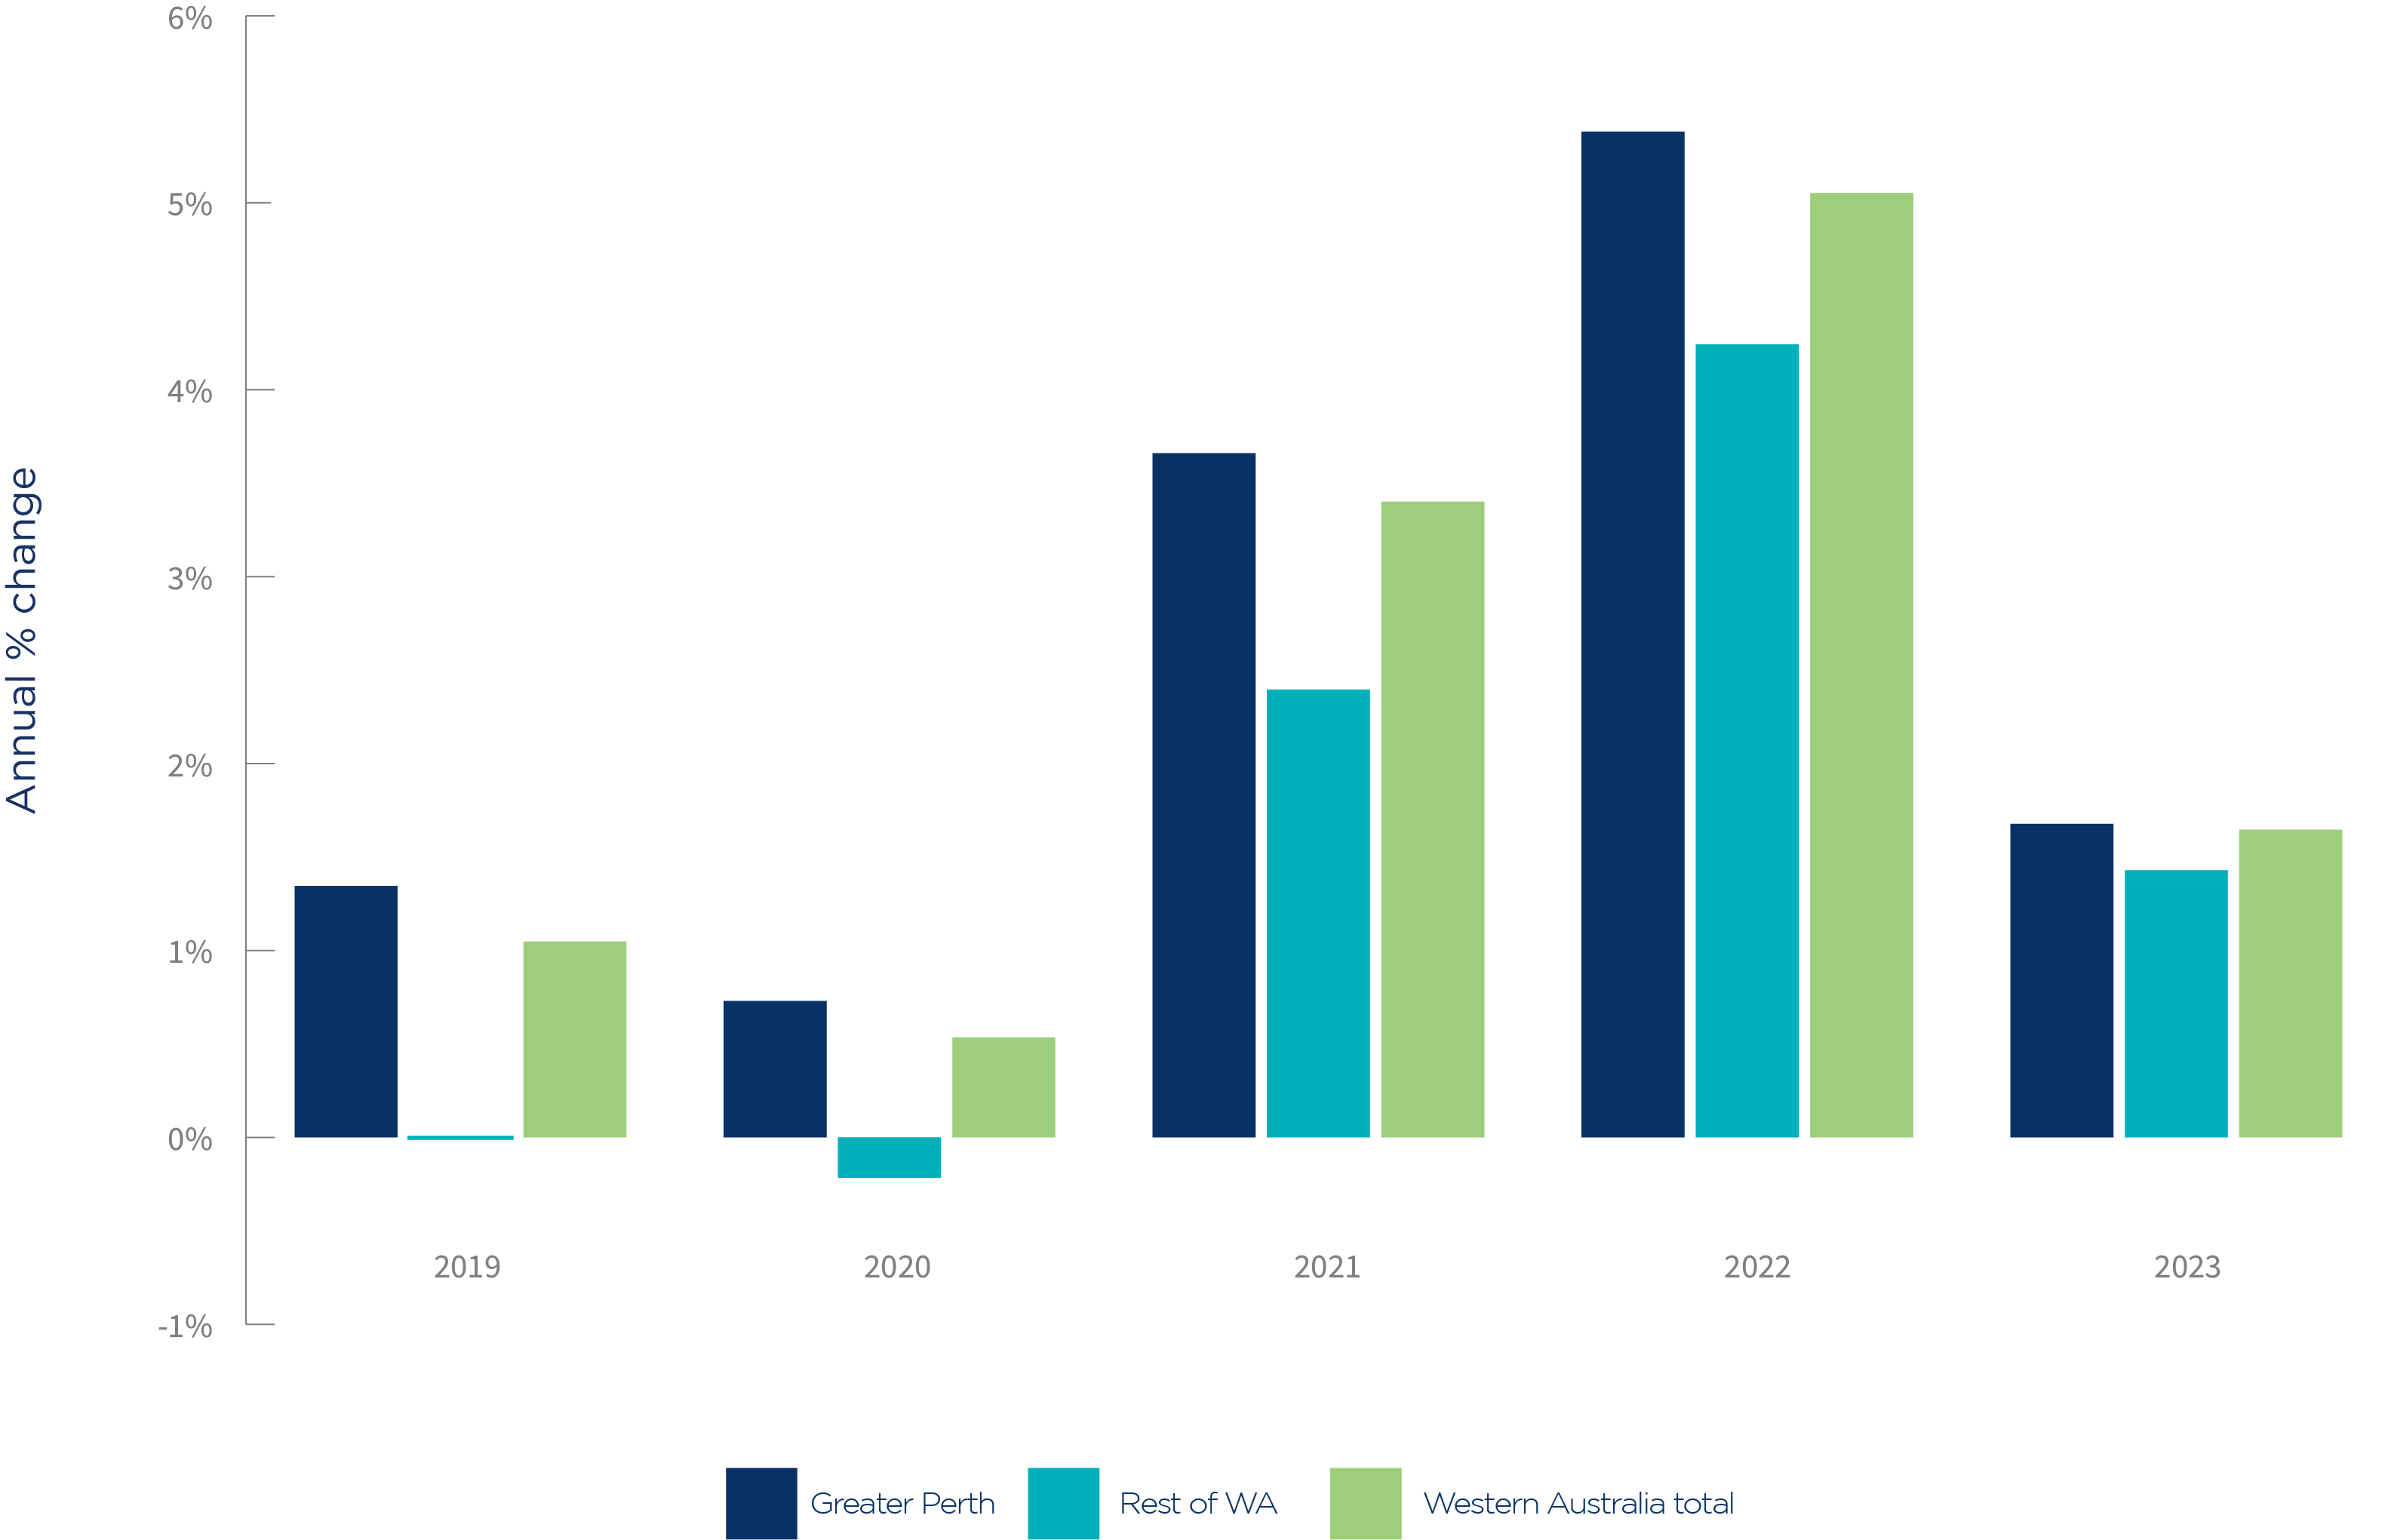
Total includes a small number of businesses where information is only available at the state/territory level.
Source: Based on Australian Bureau of Statistics, customised data, 2023.
The number of small businesses in Western Australia increased 2% and increased by 3,146 (2%) in Greater Perth over the year to 30 June 2023. The areas with the largest increase in small businesses numbers were in:
- Gosnells (increased by 449 small businesses)
- Swan (increased by 444 small businesses)
- Perth City (increased by 306 small businesses).
The areas with the largest percentage increase from the previous year were:
- Gosnells (increased by 5%)
- Armadale (increased by 4%)
- Swan (increased by 4%).
The number of small businesses in the rest of Western Australia increased by 671 (1%) over the year to 30 June 2023. The largest increase in the number of small businesses were in:
- Augusta – Margaret River – Busselton (increased by 265 small businesses)
- Goldfields (increased by 62 small businesses)
- West Pilbara (increased by 49 small businesses).
The areas with the largest increase by percent from the year prior were:
- Augusta – Margaret River – Busselton (increased by 4%)
- Gascoyne (increased by 4%)
- West Pilbara (increased by 4%).
There were 42,010 small businesses in Tasmania, representing 2% of Australian small businesses on 30 June 2023. This is in proportion to the 2% of Australians living in Tasmania6.
Chart 1: Small businesses in Tasmania, 30 June 2023
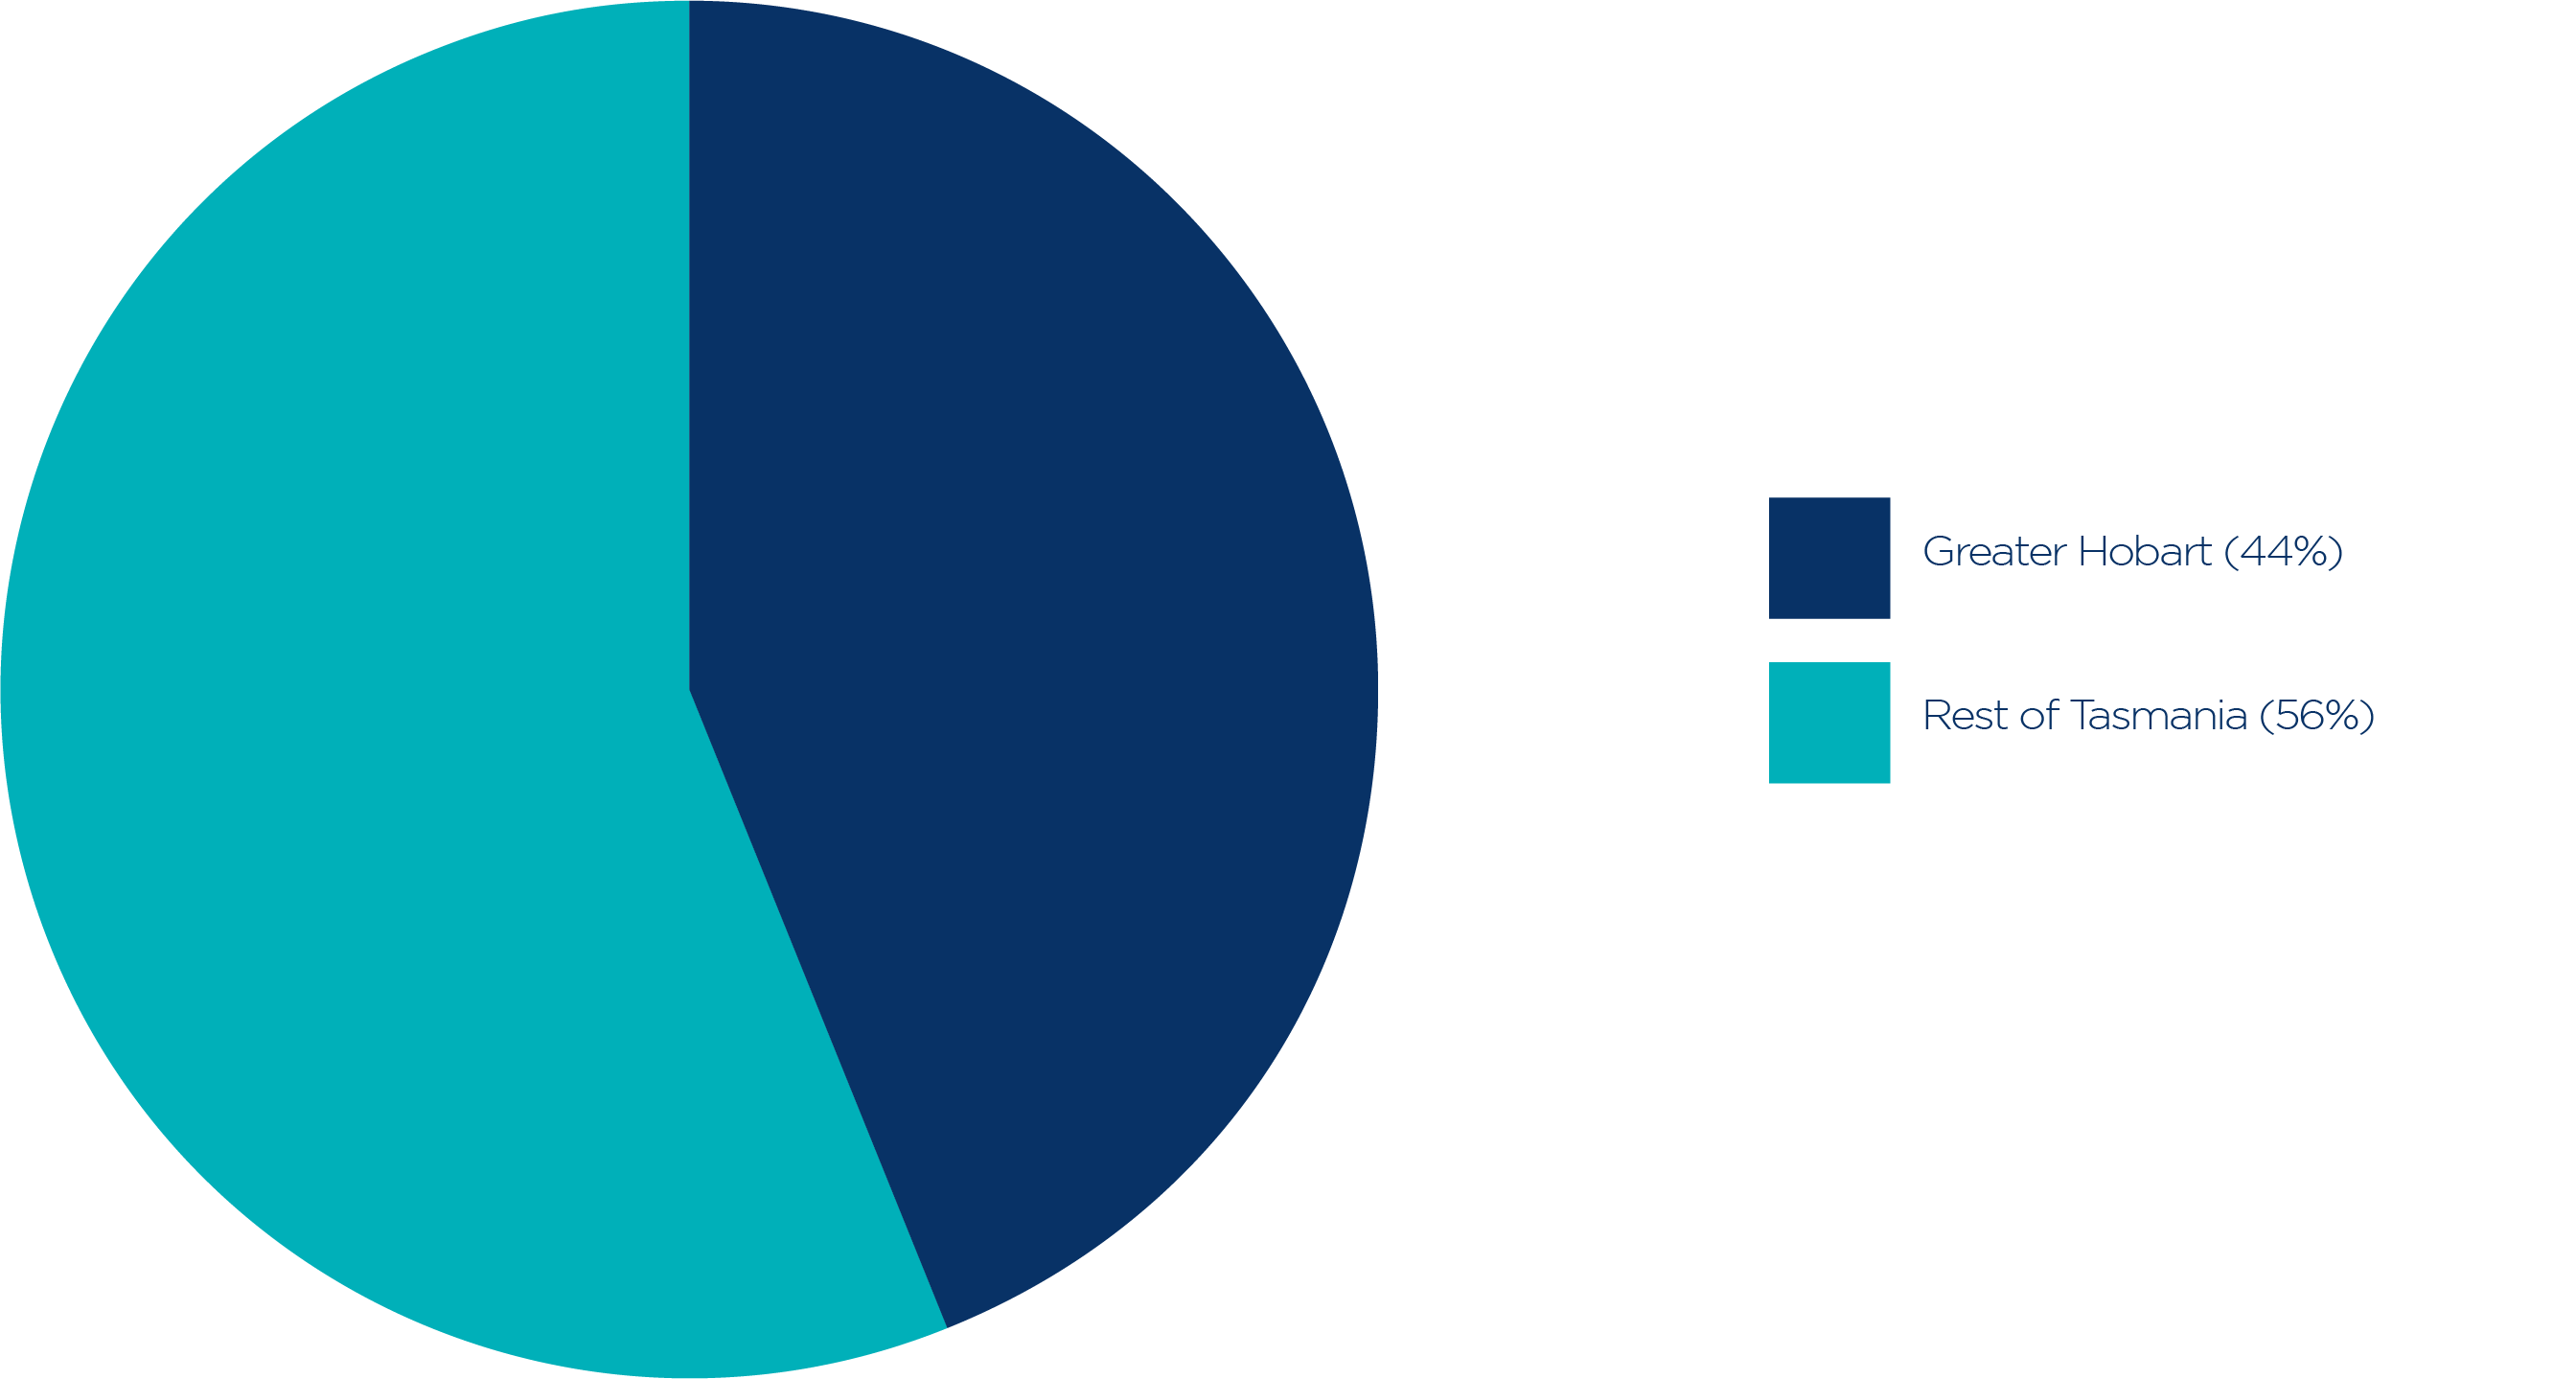
Source: Based on Australian Bureau of Statistics, customised data, 2023.
As shown above, 56% of Tasmania’s small businesses were in the rest of Tasmanian areas on 30 June 2023. This aligns with the population distribution, with 56% of the population living outside the greater capital city area of Tasmania.
Greater Hobart
There were 18,277 small businesses in Greater Hobart, representing 44% of all small businesses in Tasmania on 30 June 2023. The highest number of small businesses were in:
- Hobart (3,061 small businesses)
- Sandy Bay (1,315 small businesses)
- Cambridge (915 small businesses)
- Kingston – Huntingfield (904 small businesses)
- Sorell – Richmond (755 small businesses).
Regional Tasmania
There were 23,657 small businesses in the rest of Tasmania on 30 June 2023. These accounted for 56% of Tasmania’s small businesses. The areas with the highest number of small businesses were:
- Launceston (1,898 small businesses)
- Devonport (983 small businesses)
- Scottsdale – Bridport (871 small businesses)
- Deloraine (671 small businesses)
- Huonville – Franklin (656 small businesses).
6 Australian Bureau of Statistics, Regional Population, 2021-22, Accessed 15 January 2024
Table 1: Businesses in Tasmania by size, 30 June 2023
Number of employees | Number of businesses in Greater Hobart | Number of businesses in rest of Tasmania | Total number of businesses in Tasmania1 |
Non-employing | 11,347 | 14,484 | 25,868 |
1-4 employees2 | 4,804 | 6,266 | 11,097 |
5-19 employees | 2,126 | 2,907 | 5,045 |
Small businesses | 18,277 | 23,657 | 42,010 |
20-99 employees | 534 | 671 | 1,228 |
100-199 employees | 38 | 46 | 95 |
200+ employees | 20 | 25 | 82 |
Total | 18,869 | 24,399 | 43,415 |
1 Includes businesses where information is only available at the state/territory level.
2 This includes a small number of businesses which have income tax withholding roles for purposes other than withholding amounts from wages and salaries (and as such have zero employment).
3Calculated by ASBFEO based on the ABS definition of small business of 0-19 employees.
Source: Based on Australian Bureau of Statistics, customised data, 2023.
Changes in small businesses numbers for Tasmania
Chart 2: Annual change in the number of small businesses in Tasmania
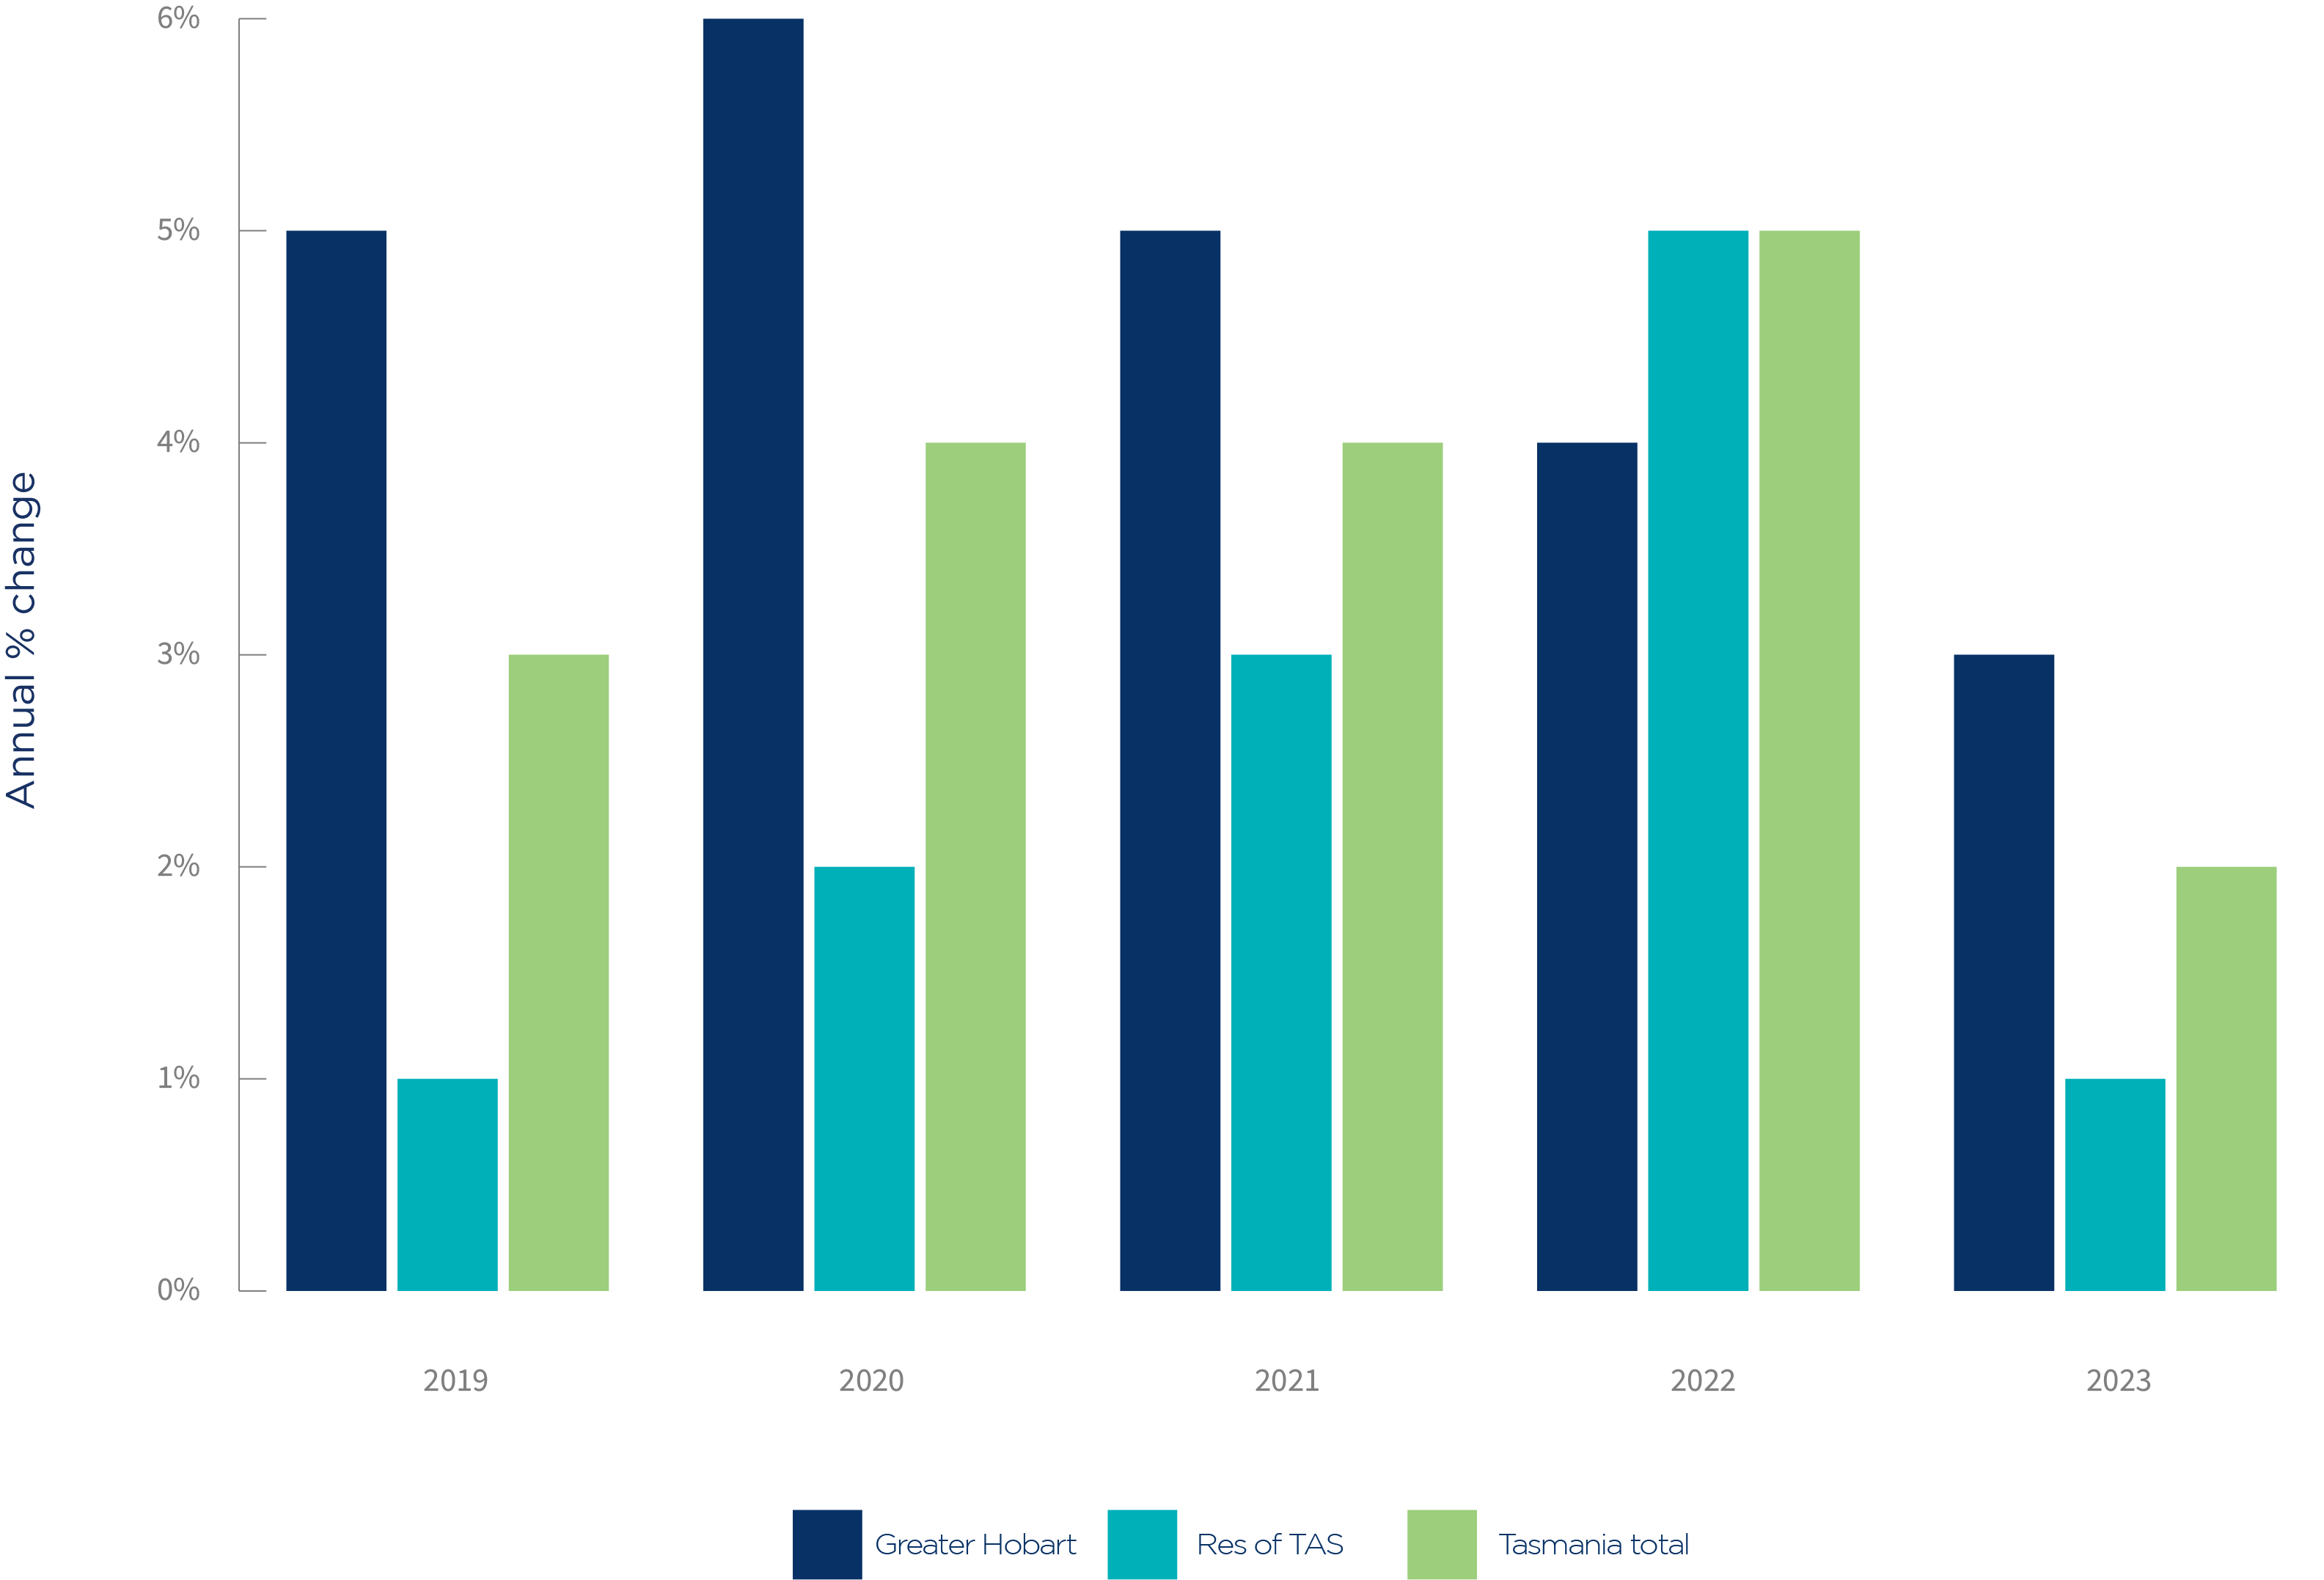
Total includes a small number of businesses where information is only available at the state/territory level.
Source: Based on Australian Bureau of Statistics, customised data, 2023.
The number of small businesses in Tasmania increased 2% over the year to 30 June 2023. They increased by 533 (3%) in Greater Hobart. The areas with the largest increase in the number of small businesses were:
- Rokeby (increased by 51 small businesses)
- New Norfolk (increased by 51 small businesses)
- Glenorchy (increased by 49 small businesses).
The areas with the largest percentage increase from the previous year were:
- New Norfolk (increased by 18%)
- Rokeby (increased by 17%)
- Risdon Vale (increased by 14%).
The number of small businesses in the rest of Tasmania increased by 152 (1%) over the year to 30 June 2023. The areas with the largest increase in the number of small businesses were:
- Riverside (increased by 43 small businesses)
- Legana (increased by 39 small businesses)
- Grindelwald – Lanena (increased by 32 small businesses).
The areas with the largest percentage increase from the previous year were:
- Legana (increased by 13%, to 298 small businesses)
- West Ulverstone (increased by 11%, to 163 small businesses)
- Central Highlands (increased by 11%, to 257 small businesses).
There were 15,431 small businesses in the Northern Territory, representing 1% of Australian small businesses on 30 June 2023. This is consistent with the 1% of Australians living in the Northern Territory7.
Chart 1: Small businesses in Northern Territory, 30 June 2023
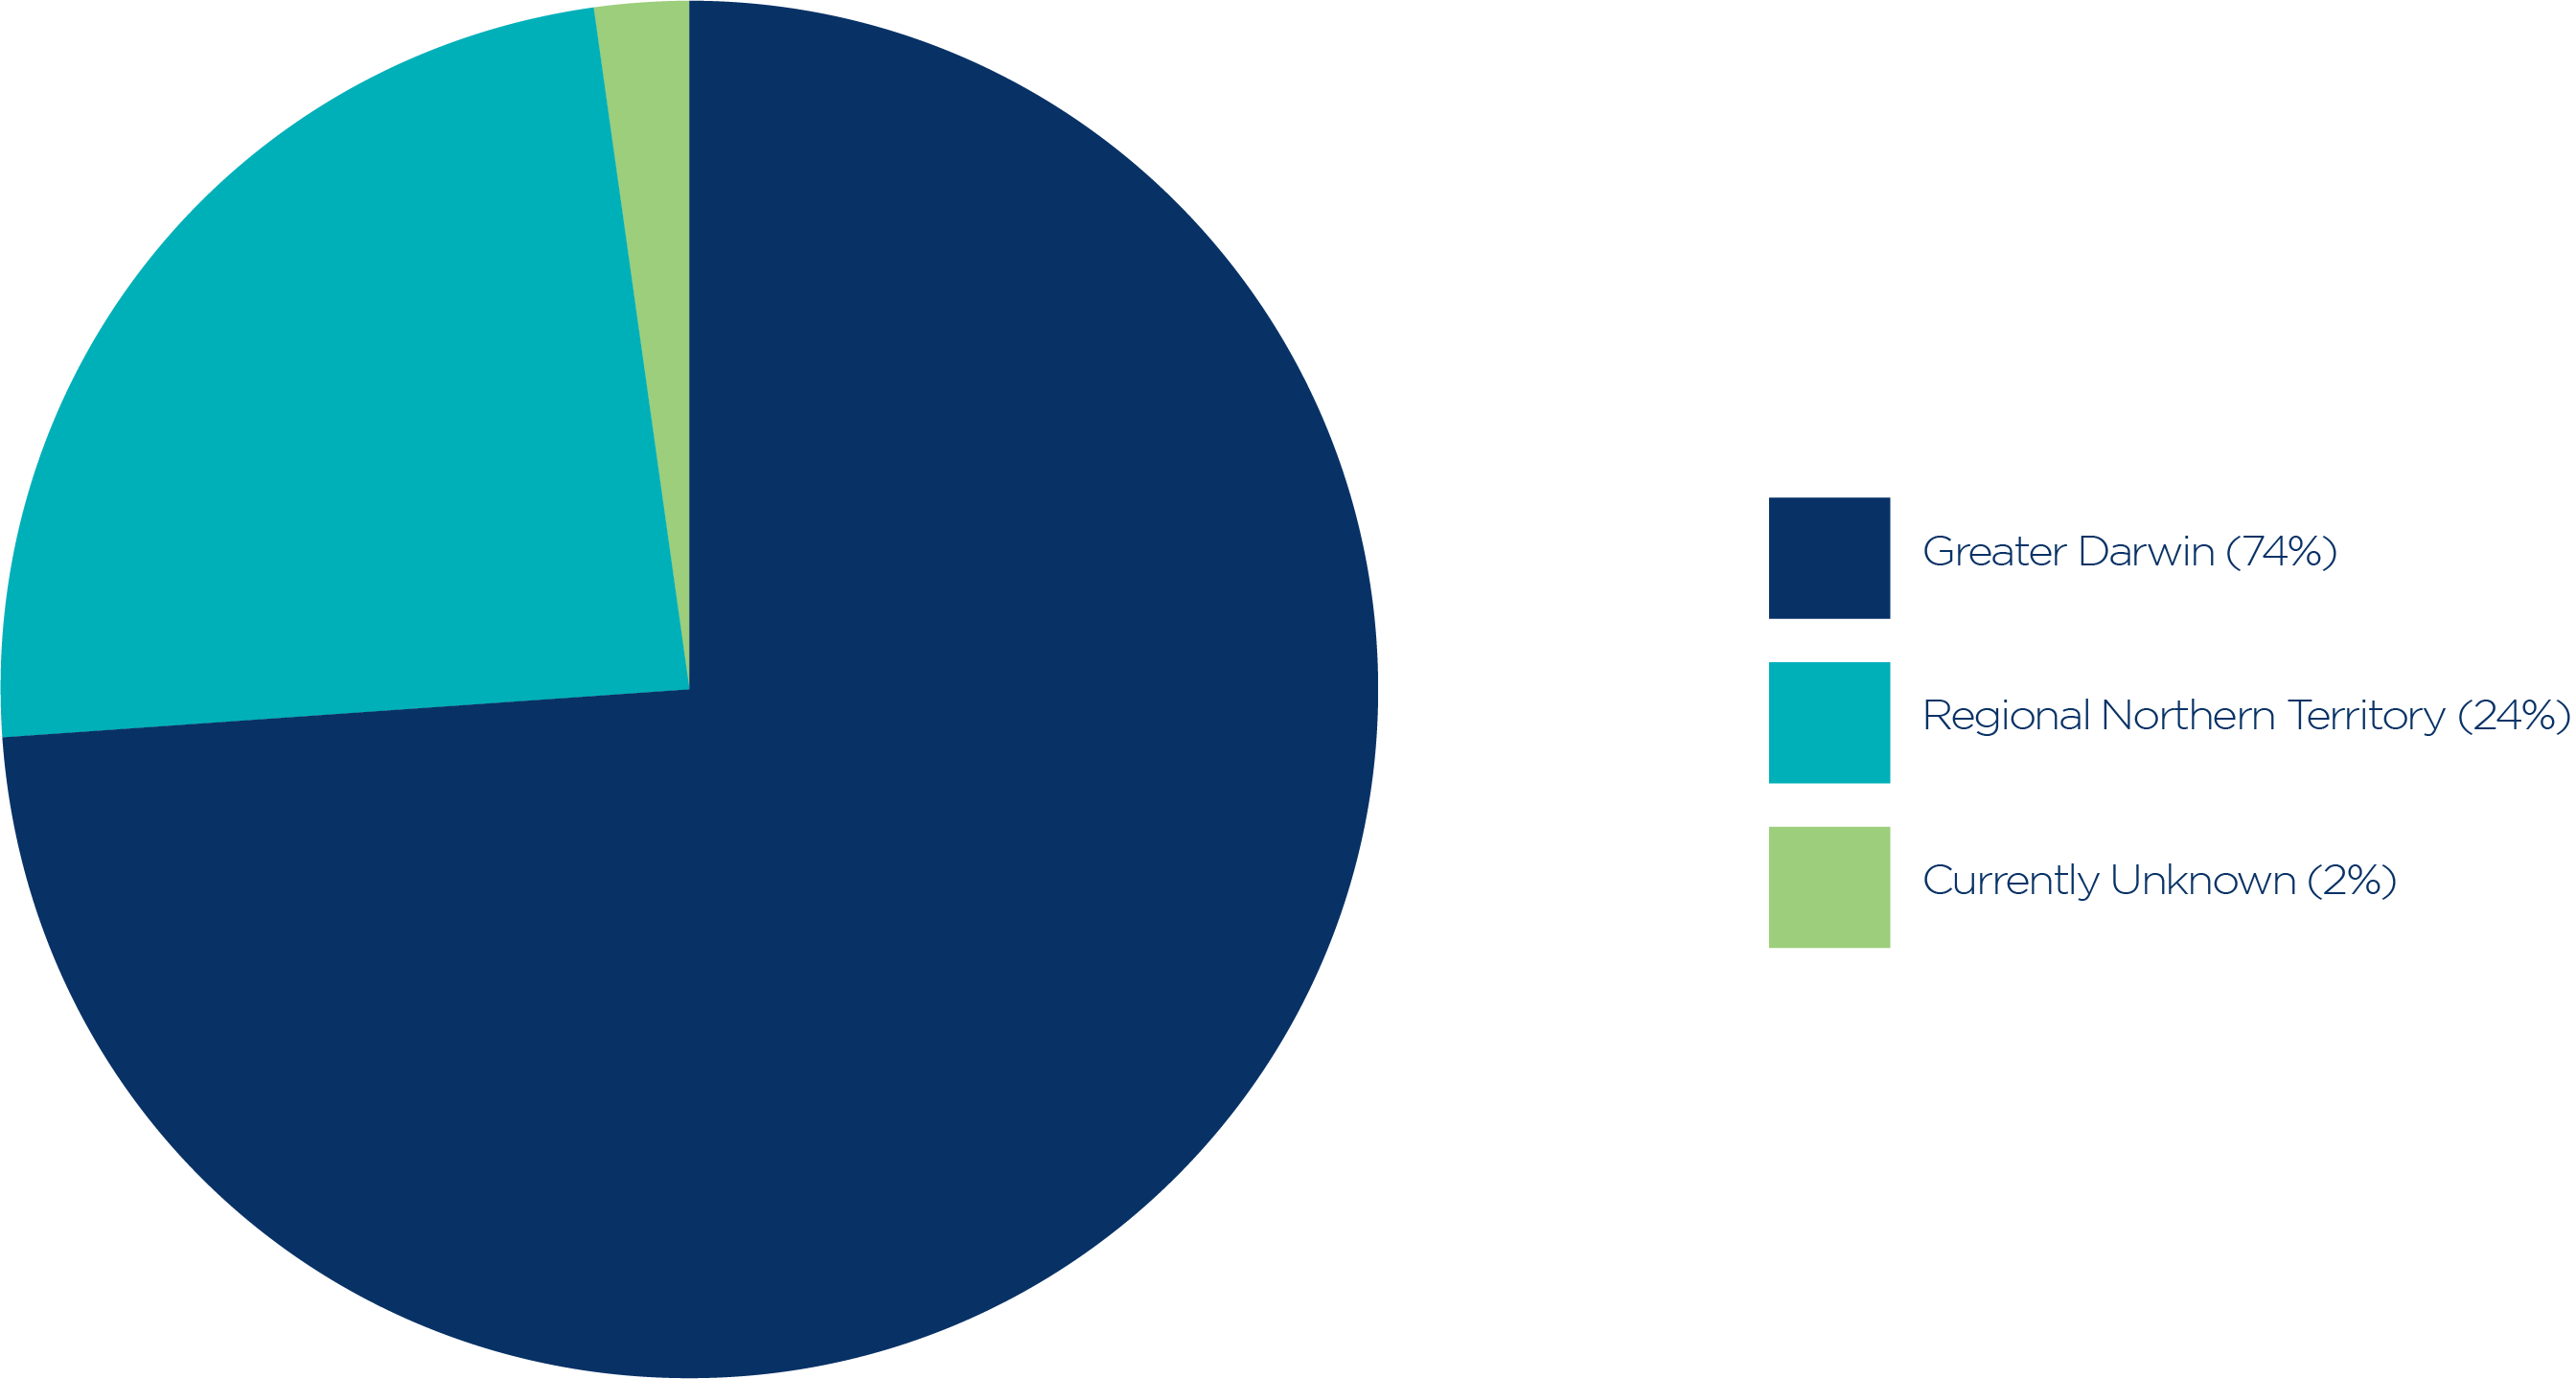
Source: Based on Australian Bureau of Statistics, customised data, 2023.
Greater Darwin
Although only 60% of the Northern Territory’s population lived in the Greater Darwin area8, 74% (11,454) of the Territory’s small businesses were in Greater Darwin on 30 June 2023. The areas with the highest number of small businesses were:
- Darwin City (1,301 small businesses)
- Woolner – Bayview – Winnellie (998 small businesses)
- Humpty Doo (790 small businesses)
- Weddell (457 small businesses)
- Berrima (456 small businesses).
Regional Northern Territory
There were 3,729 small businesses in the rest of the Northern Territory on 30 June 2023. These accounted for 24% of the Northern Territory’s small businesses. The highest number of small businesses were in:
- Katherine (880 small businesses)
- Charles (813 small businesses)
- Alligator (297 small businesses)
- East Side (248 small businesses)
- Larapinta (218 small businesses).
7 Australian Bureau of Statistics, Regional Population, 2021-22, Accessed 15 January 2024
8 Australian Bureau of Statistics, Regional Population, 2021-22, Accessed 15 January 2024
Table 1: Businesses in Northern Territory by size, 30 June 2023
Number of employees | Number of businesses in Greater Darwin | Number of businesses in the rest of the Northern Territory | Total number of businesses in Northern Territory1 |
Non-employing | 7,066 | 2,168 | 9,368 |
1-4 employees2 | 3,013 | 970 | 4,046 |
5-19 employees | 1,375 | 591 | 2,017 |
Small businesses | 11,454 | 3,729 | 15,431 |
20-99 employees | 413 | 171 | 613 |
100-199 employees | 24 | 8 | 40 |
200+ employees | 9 | 4 | 23 |
Total | 11,900 | 3,912 | 16,107 |
1 Includes businesses where information is only available at the state/territory level.
2 This includes a small number of businesses which have income tax withholding roles for purposes other than withholding amounts from wages and salaries (and as such have zero employment).
3Calculated by ASBFEO based on the ABS definition of small business of 0-19 employees.
Source: Based on Australian Bureau of Statistics, customised data, 2023.
Changes in small businesses numbers for the Northern Territory
Chart 2: Annual change in the number of small businesses in the Northern Territory
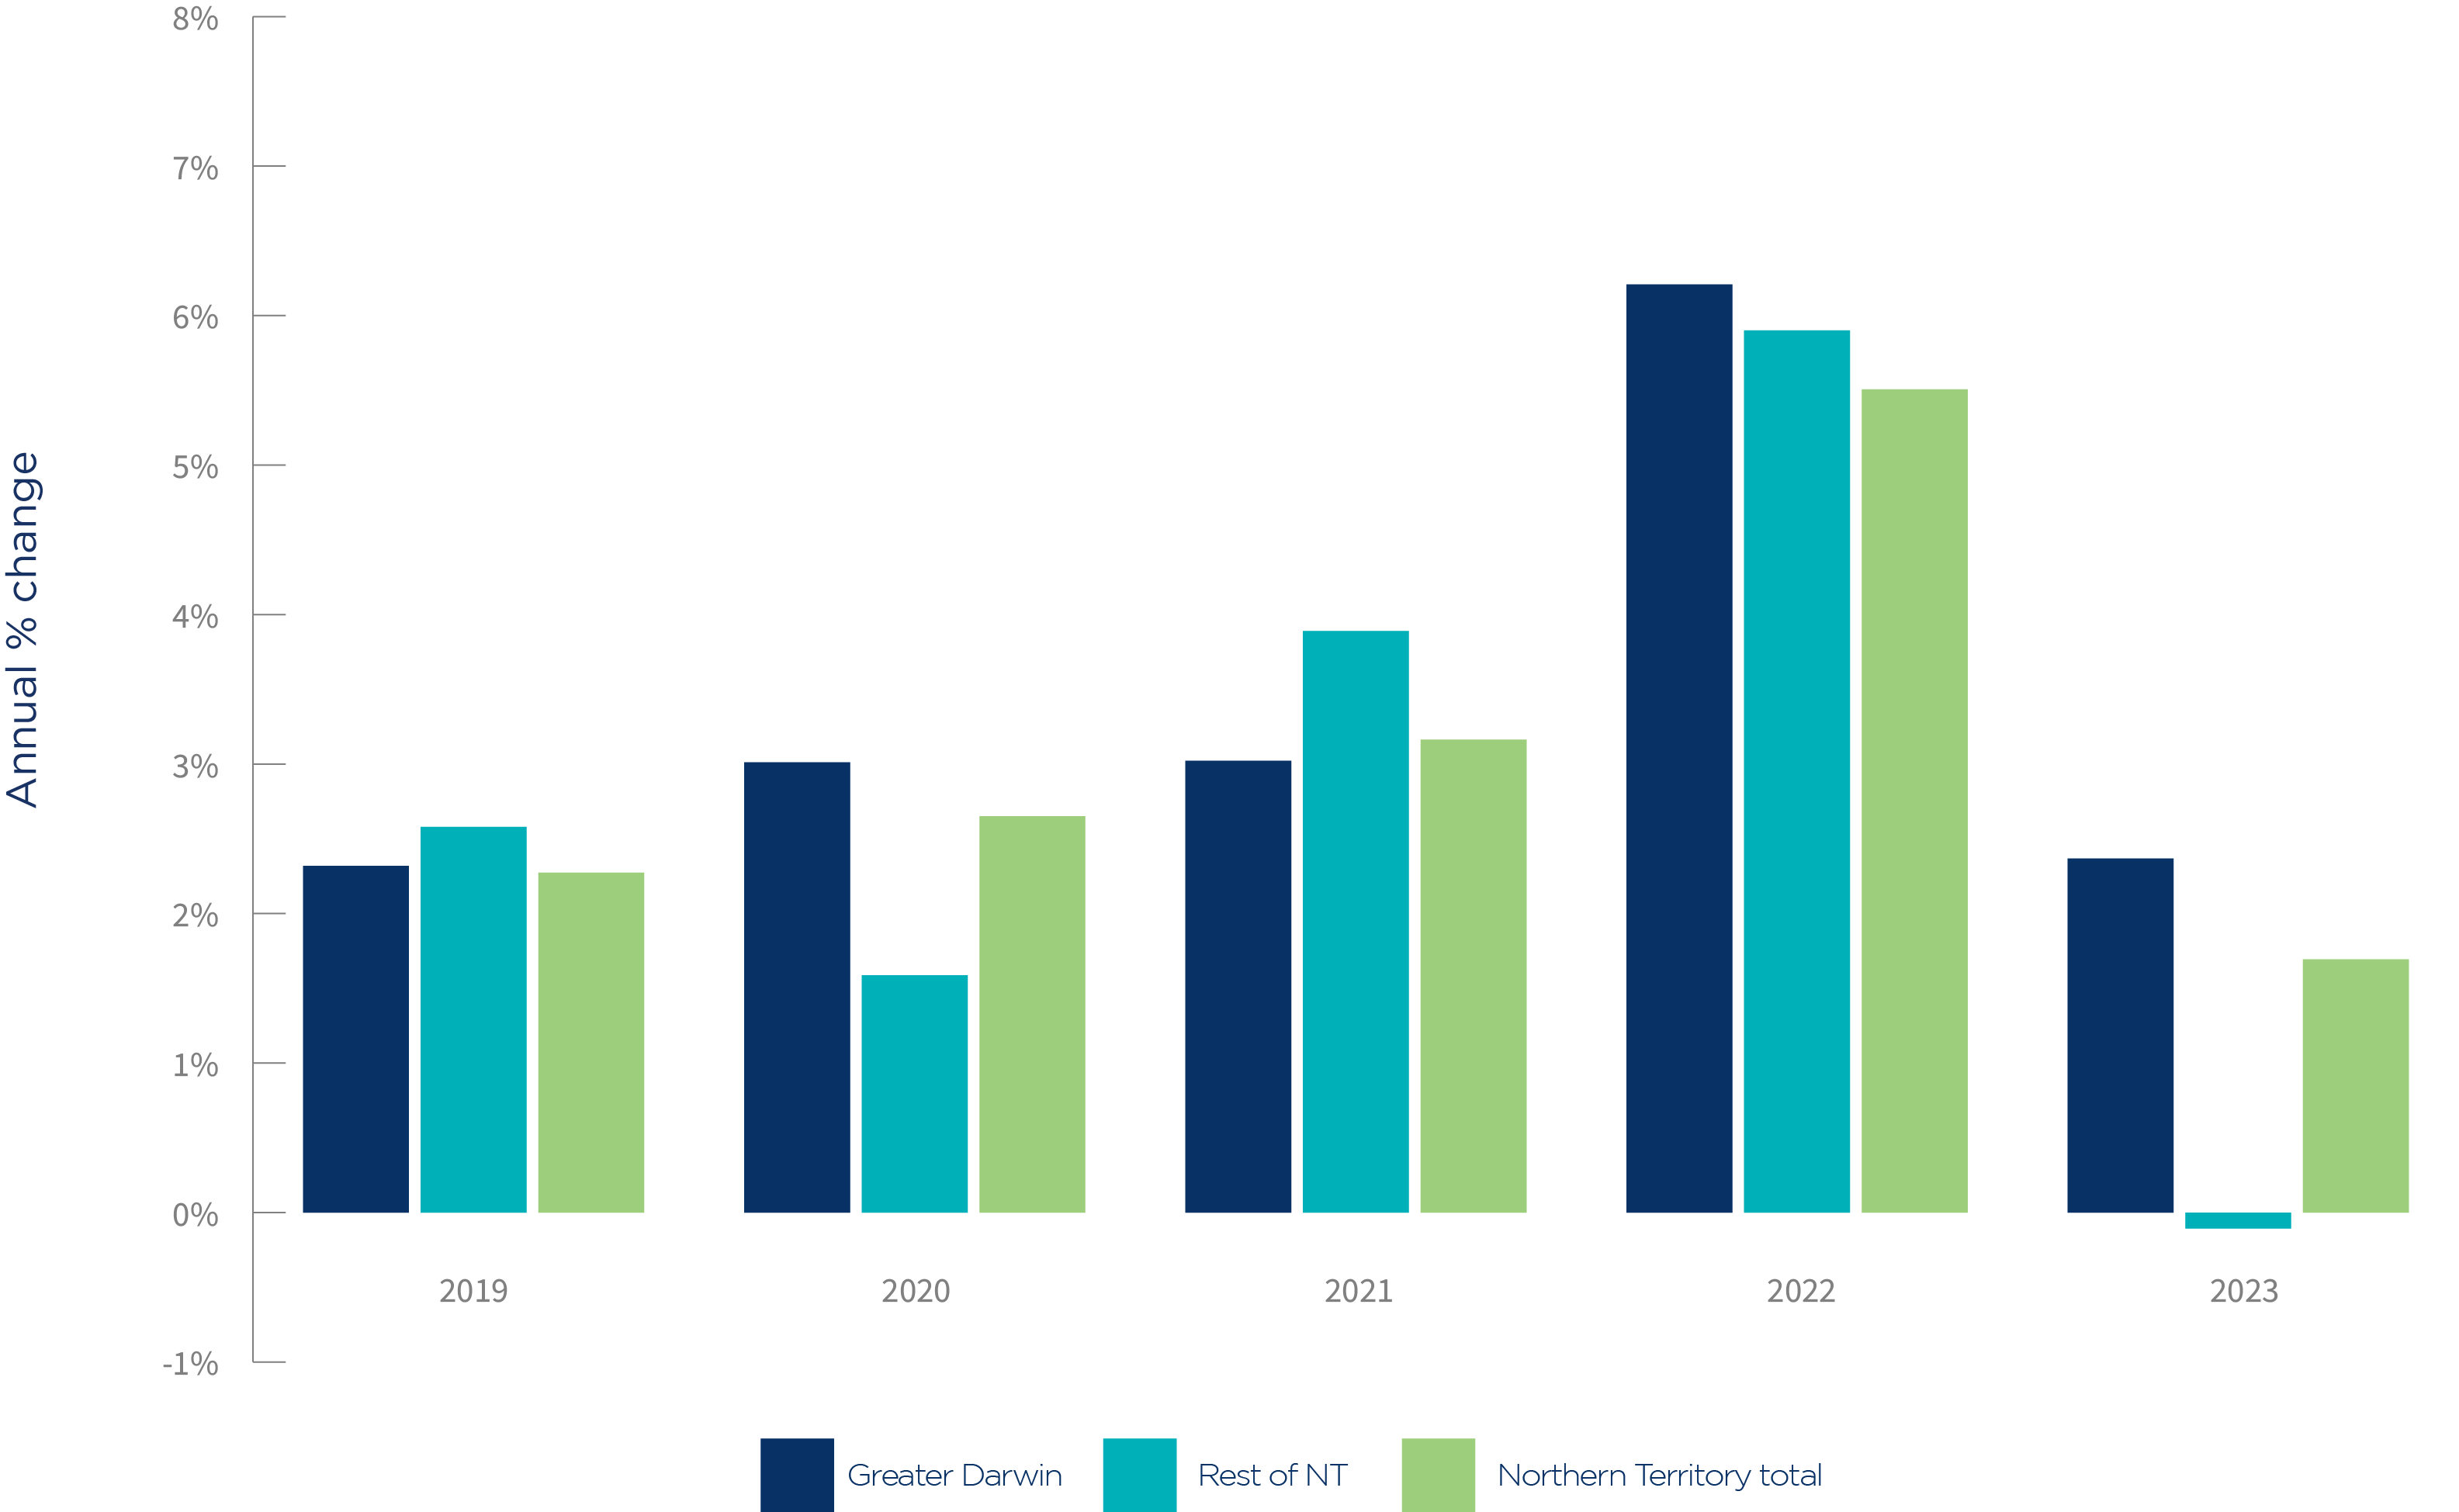
Total includes a small number of businesses where information is only available at the state/territory level.
Source: Based on Australian Bureau of Statistics, customised data, 2023.
The number of small businesses in the Northern Territory increased 2% over the year to 30 June 2023. They increased 2% (265) in Greater Darwin. The areas with the largest increase in the number of small businesses were:
- Darwin City (increased by 37 small businesses)
- Woolner – Bayview – Winnellie (increased by 33 small businesses)
- Wulagi (increased by 30 small businesses).
Wulagi had the highest increase in percentage terms. The number of small businesses increased by 25% (30) over the year to 30 June 2023.
The number of small businesses in the rest of the Northern Territory decreased by 4 (0.1%) over the year to 30 June 2023. The largest fall occurred in Charles, where the number decreased by 6% (48 small businesses).
There were 33,992 small businesses in the Australian Capital Territory (ACT) on 30 June 2023, representing 1% of all Australian small businesses. This is consistent with the proportion of Australia’s population living in the ACT (2%)9.
The areas in the ACT with the highest number of small businesses were:
- Civic (1,450 small businesses)
- Fyshwick (1,448 small businesses)
- Kingston (907 small businesses)
- Deakin (764 small businesses)
- Gungahlin (764 small businesses).
Table 1: Businesses in ACT by size, 30 June 2023
Number of employees | Total number of businesses in Australian Capital Territory1 |
Non-employing | 19,524 |
1-4 employees2 | 10,911 |
5-19 employees | 3,557 |
Small businesses | 33,992 |
20-99 employees | 977 |
100-199 employees | 75 |
200+ employees | 54 |
Total | 35,098 |
1 Includes businesses where information is only available at the state/territory level.
2 This includes a small number of businesses which have income tax withholding roles for purposes other than withholding amounts from wages and salaries (and as such have zero employment).
3Calculated by ASBFEO based on the ABS definition of small business of 0-19 employees.
Source: Based on Australian Bureau of Statistics, customised data, 2023.
9Australian Bureau of Statistics, Regional Population, 2021-22, Accessed 15 January 2024
Changes in small businesses numbers for the ACT
Chart 1: Annual change in the number of small businesses in the ACT
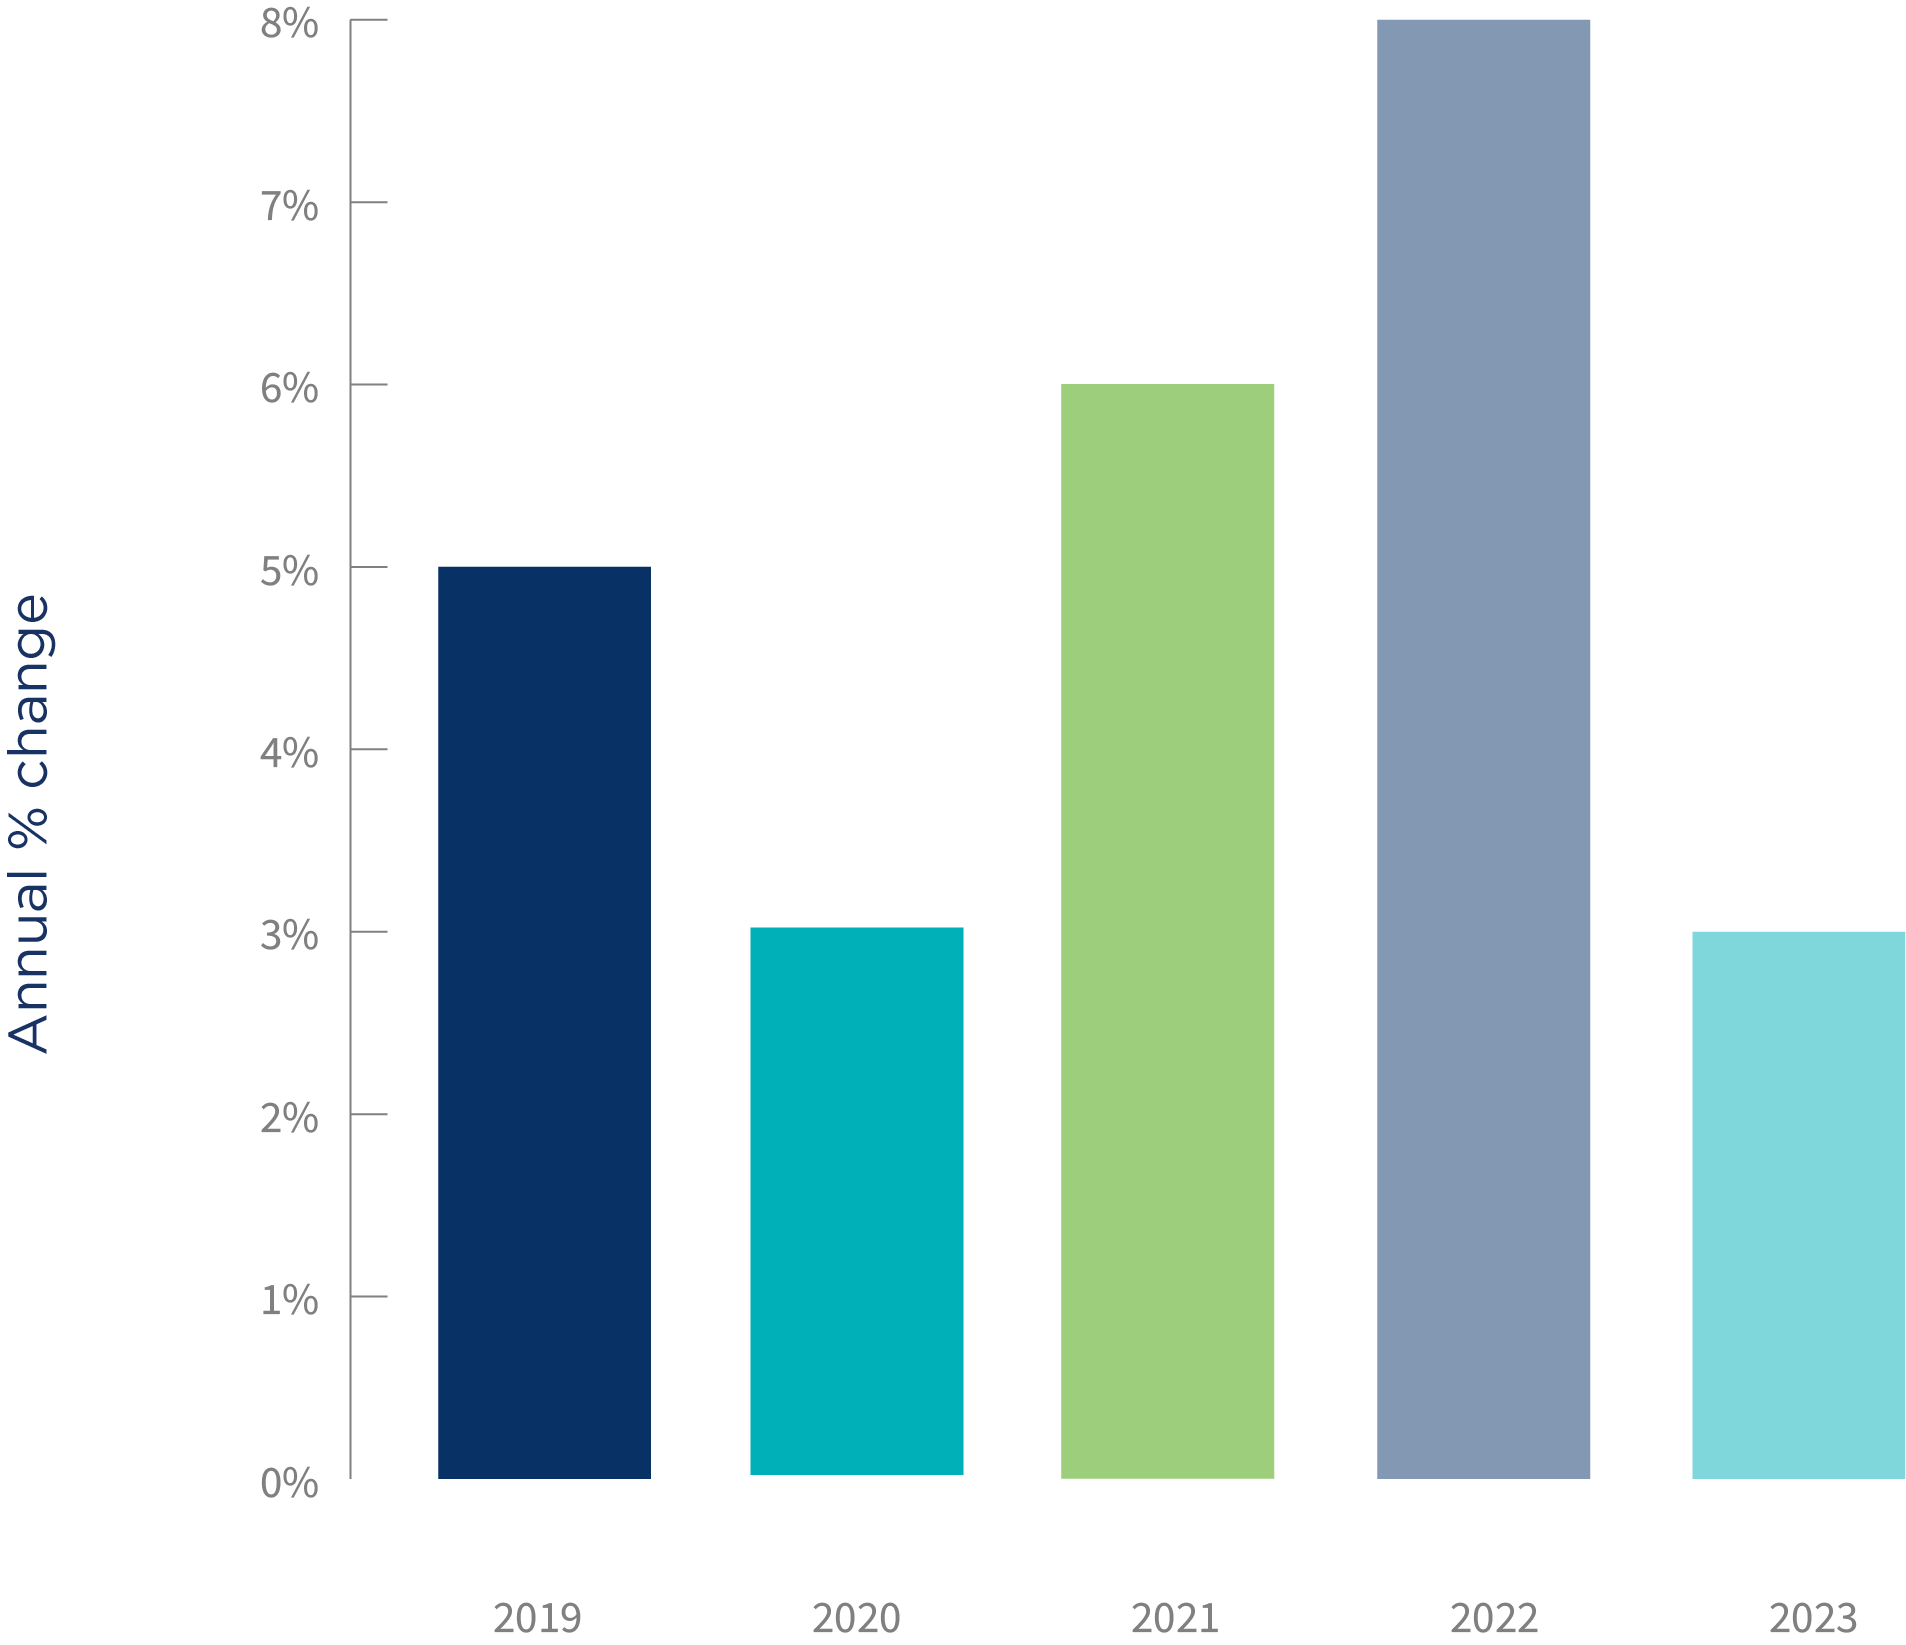
Total includes a small number of businesses where information is only available at the state/territory level.
Source: Based on Australian Bureau of Statistics, customised data, 2023.
The number of small businesses in the ACT increased by 1,086 (3%) over the year to 30 June 2023. The areas with the largest increase were:
- Braddon (increased by 82 small businesses)
- Denman Prospect (increased by 82 small businesses)
- Taylor (increased by 82 small businesses).
Other Territories incorporates Christmas Island, Cocos (Keeling) Islands, Jervis Bay and Norfolk Island.
Table 1: Small businesses in Other Territories, 30 June 2023
Number of employees | Total number of businesses in Other Territories1 |
Non-employing | 1,704 |
1-4 employees2 | 172 |
5-19 employees | 10 |
Small businesses | 1,886 |
20-99 employees | 0 |
100-199 employees | 0 |
200+ employees | 0 |
Total | 1,888 |
1 Includes businesses where information is only available at the state/territory level.
2 This includes a small number of businesses which have income tax withholding roles for purposes other than withholding amounts from wages and salaries (and as such have zero employment).
3Calculated by ASBFEO based on the ABS definition of small business of 0-19 employees.
Source: Based on Australian Bureau of Statistics, customised data, 2023.
There were 1,888 small businesses in Other Territories on 30 June 2023. Of these, 90% were non-employing businesses.
Changes in small businesses numbers for Other Territories
Chart 1: Annual change in the number of small businesses in Other Territories
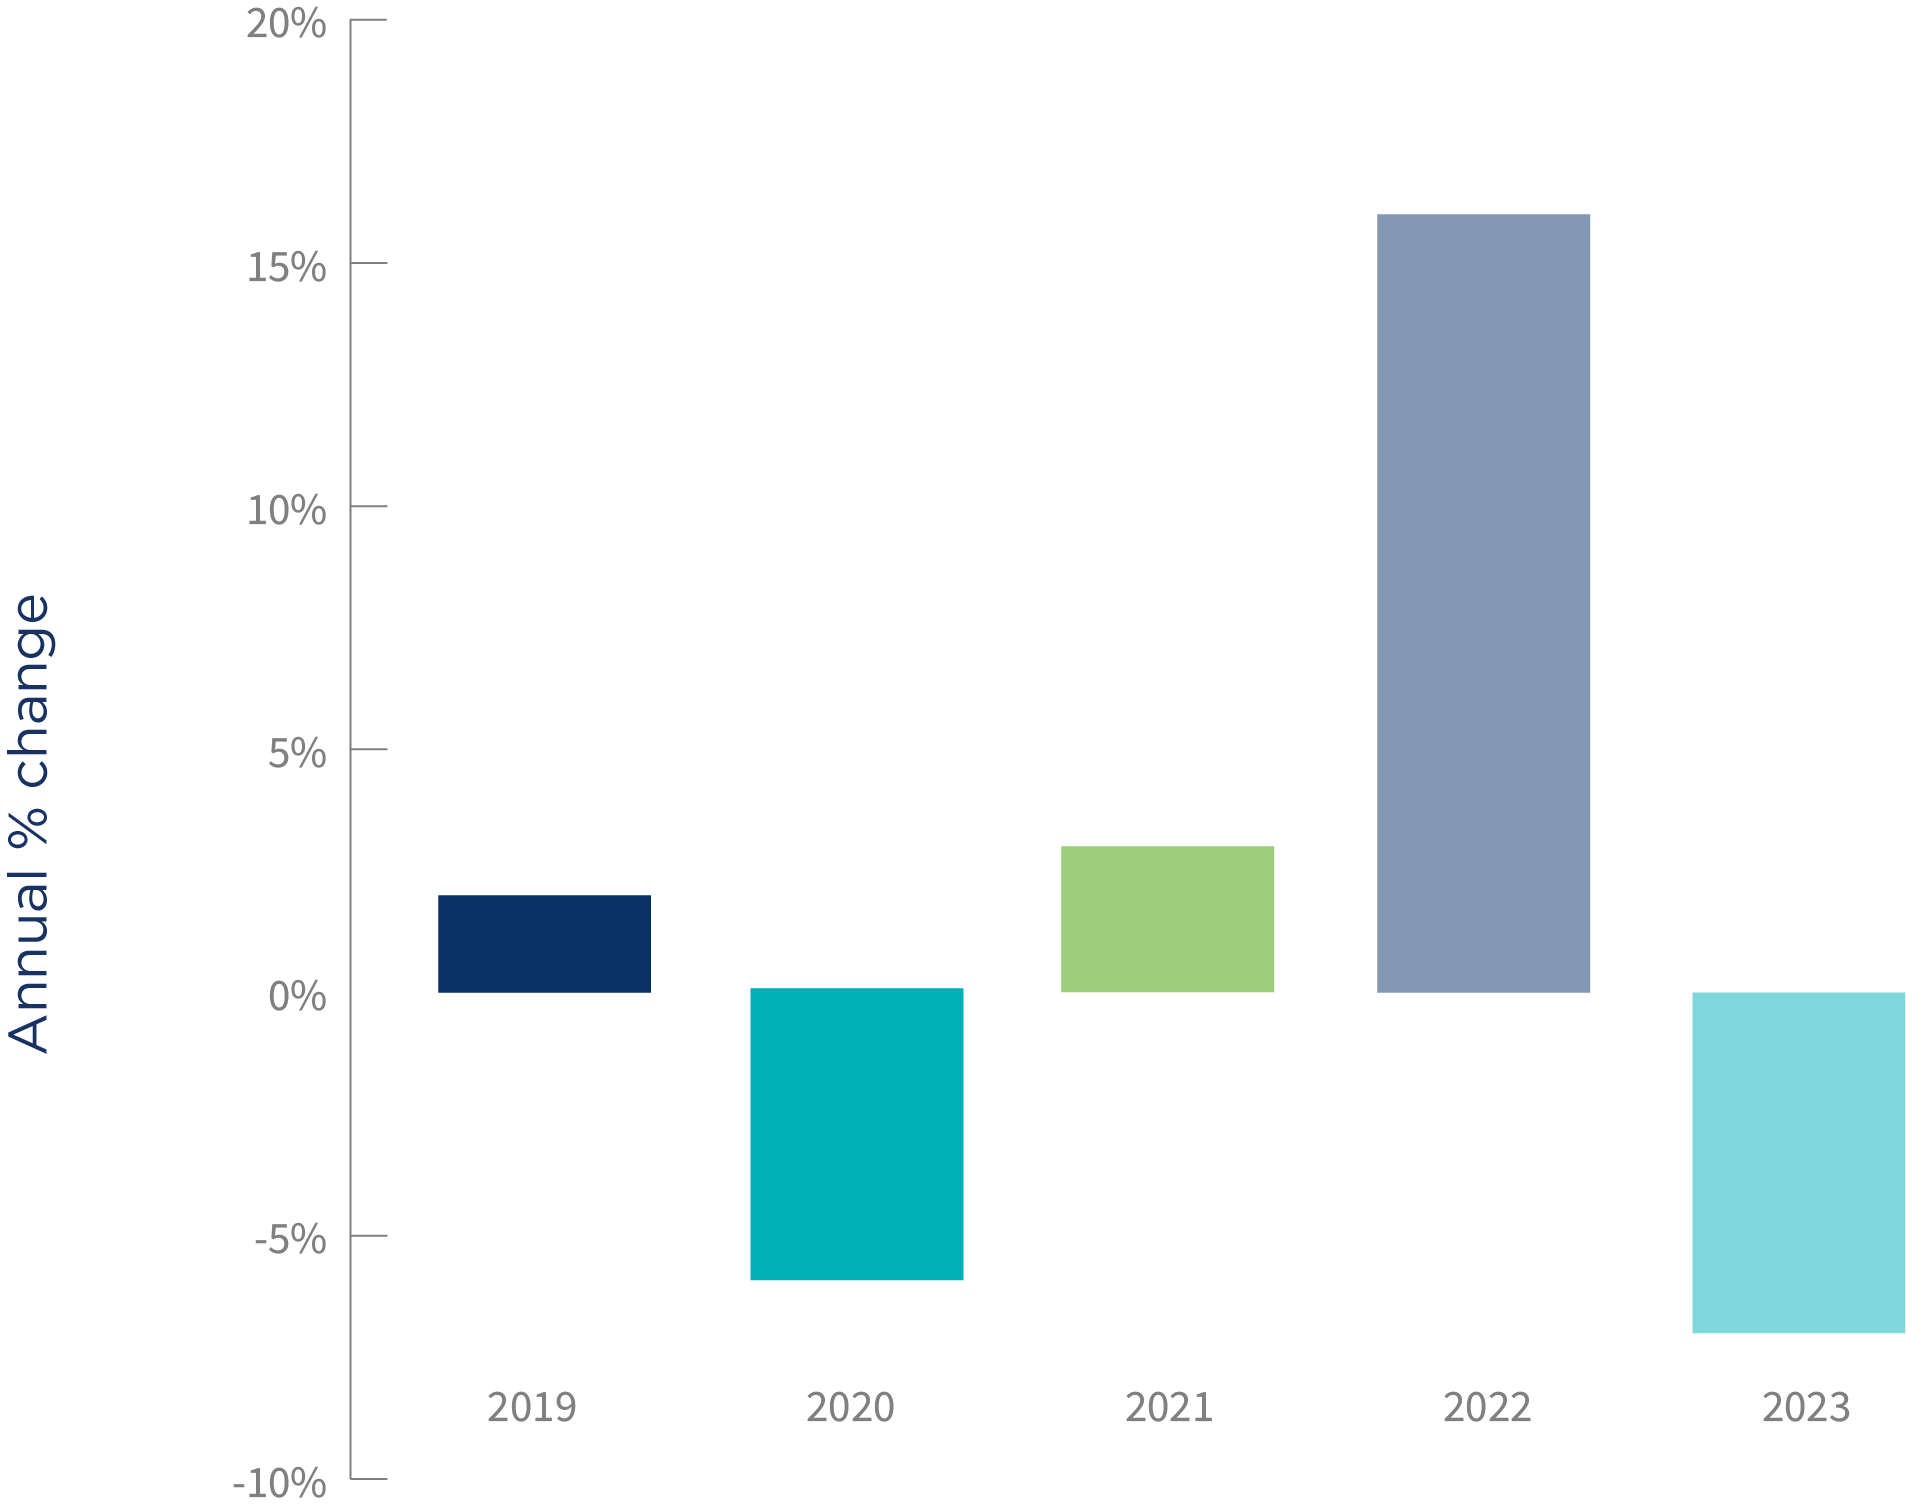
Source: Based on Australian Bureau of Statistics, customised data.
The number of small businesses in Other Territories decreased by 150 (7%) over the year to 30 June 2023, after a 16% increase in the previous year.
Data notes:
Businesses can operate across multiple geographic locations. To prevent double counting, this data attributes them to one geographical location. For this reason, the business counts may not reflect the full extent of business activity in each location.
The Australian Small Business and Family Enterprise Ombudsman (ASBFEO) defines small businesses as those with less than 20 employees for this data. The data is classified using the Australian Statistical Geography Standard (ASGS).
This data excludes businesses not registered for GST. Cells may not add up to totals due to the Australian Bureau of Statistics adjusting cells to avoid releasing confidential information. Exercise care when analysing small numbers for this reason. For further information see Australian Bureau of Statistics, Counts of Australian Businesses, Including Entries and Exits methodology.